How to Build an Algo Trading Strategy
How to Build an Algo Trading Strategy (No Coding): StrykeX Builder Tutorial (2026)
Step-by-step tutorial: build and backtest your own algo trading strategy without coding using the StrykeX Strategy Builder. Learn entry/exit rules, backtesting, slippage, and how to deploy — with a full worked example.
How to Build an Algo Trading Strategy Without Coding: A Step-by-Step StrykeX Builder Tutorial
You can build a complete algo trading strategy without writing any code using the StrykeX Strategy Builder.
The flow is five steps:
- name your strategy and pick the instrument,
- set the chart and timeframe,
- define your entry and exit conditions using indicators,
- configure execution and risk management,
- preview, backtest, and deploy.
This guide walks through each step with a real worked example — a MACD strategy on Nifty — including the crucial lesson of adding slippage to get realistic results
One of the biggest myths in algo trading is that you need to be a programmer. You don’t. In this tutorial — which you can follow along with in the video above — we’ll build a working algo strategy from scratch using the StrykeX Strategy Builder, no code required. We’ll create it, backtest it, learn why the first version isn’t good enough, refine it, and deploy it. By the end, you’ll understand the whole workflow and be able to build your own.
New to the concept first? Our what is algo trading and can you do algo trading without coding guides give you the background. Ready? Let’s build.
Meet the StrykeX Strategy Builder
From your dashboard, open the Strategy Builder tab and click Build Custom Strategies. You get two ways to start: create a new strategy from absolute scratch (where you customise every single thing), or use a preset template of a popular strategy so you have a ready-made starting point. For this tutorial we’ll build from scratch so you see every part of the process.
When you click Create New Strategy, you’ll see four builder types to choose from:
- Indicator & price-action based builder — the one we’ll use in this tutorial.
- Option-selling time-based builder — for time-driven option strategies.
- TradingView Pine-based builder — being introduced, to connect TradingView signals.
- AI-powered no-code builder (powered by Claude and Perplexity) — being introduced; you type a prompt and the system builds an algo strategy for you.
We’ll click the indicator and price-action based builder and get started.
Step 1: Strategy Overview (Name, Segment & Instrument)
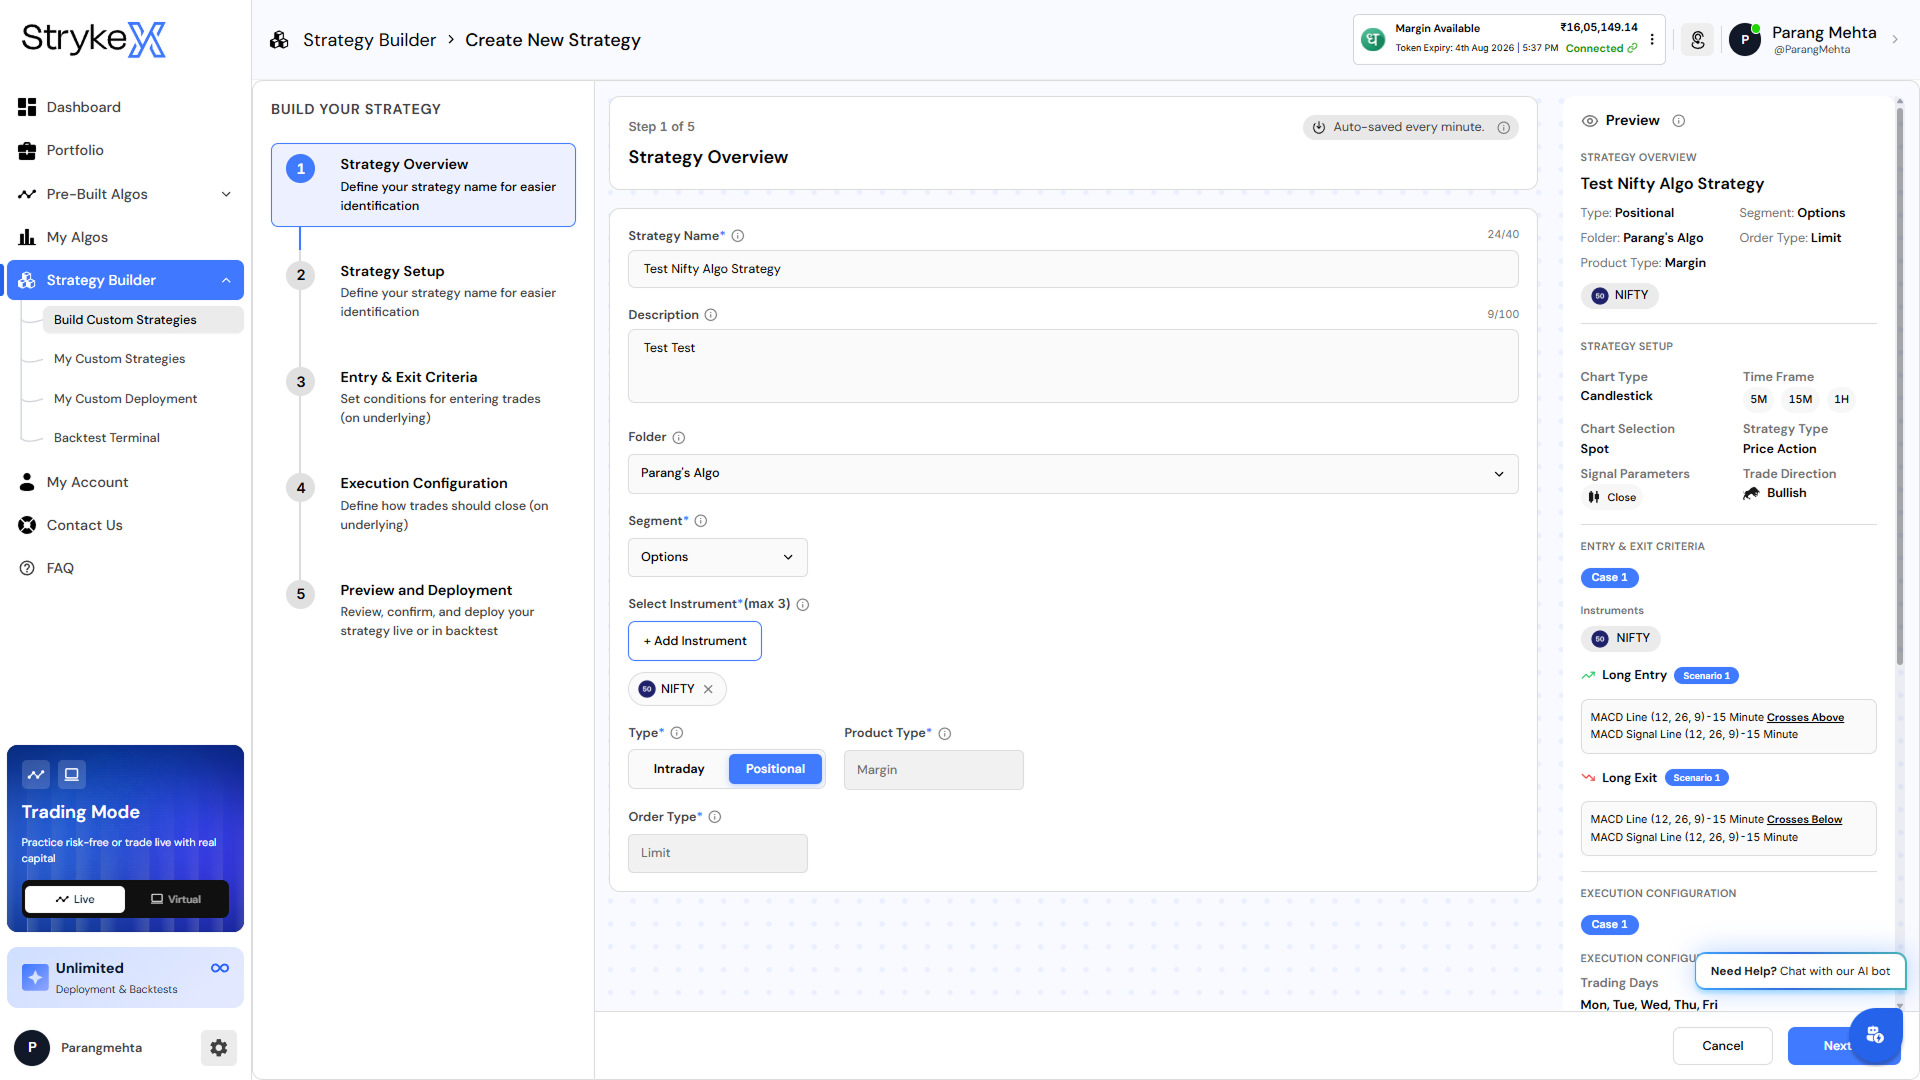
Choose Build From Scratch and you land on the strategy overview. Here you set the basics:
- Name: give it a clear name — we’ll call ours “Test Nifty Algo Strategy.”
- Description: optional, but useful for remembering what it does.
- Folder: organise it — we’ll file it under “Parang’s Algo.”
- Segment & instrument: we’ll choose Options and select Nifty as the instrument.
- Type: Intraday or Positional — we’ll make this a Positional strategy.
You can add up to three instruments at once for now (support for up to 10 is on the way). With that done, Step 1 is complete.
Strategy Overview
Step 2: Strategy Setup (Chart, Timeframe & Candles)
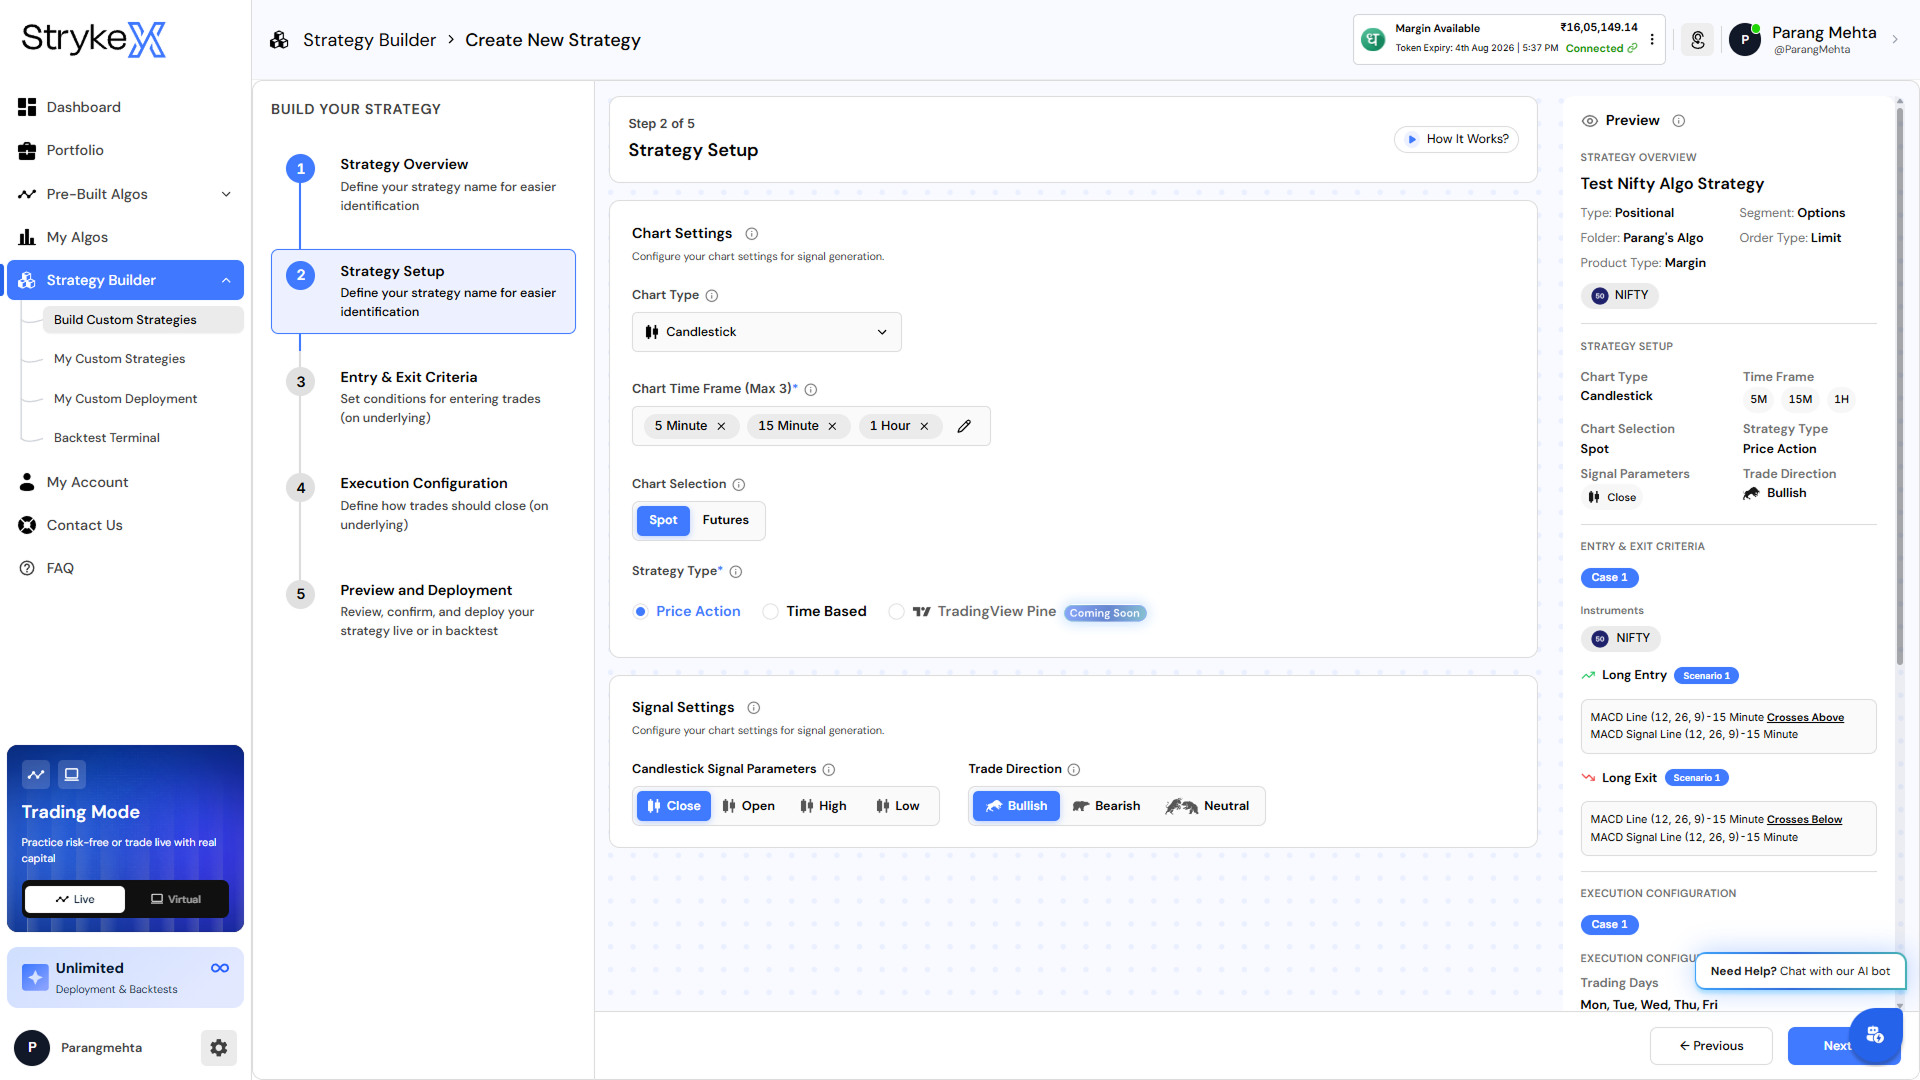
Step 2 sets up how the strategy reads the market:
- Chart type: candlesticks (Heikin-Ashi, Renko and others are planned).
- Preferred timeframes: for reference so you know what you’re building — you can change them later.
- Signal chart: choose whether the algo generates signals on the spot chart or the futures chart.
- Signal trigger: by default, candlestick close triggers events — you can switch to candle open, high, or low.
- Trade direction: bullish, bearish, or neutral.
A running summary of Steps 1 and 2 appears on the right side of the screen, and you can jump back to edit any part at any time.
Strategy Setup (Chart, Timeframe & Candles)
Step 3: Entry & Exit Criteria (The Heart of the Strategy)
This is where the strategy logic lives. First, a useful concept: you can add multiple cases. A case lets you test the same strategy across instruments, or tweak variables — for example, EMA 21/50 as one case and EMA 50/75 as another. To keep it simple, we’ll use just Case 1.
Build your indicator collection
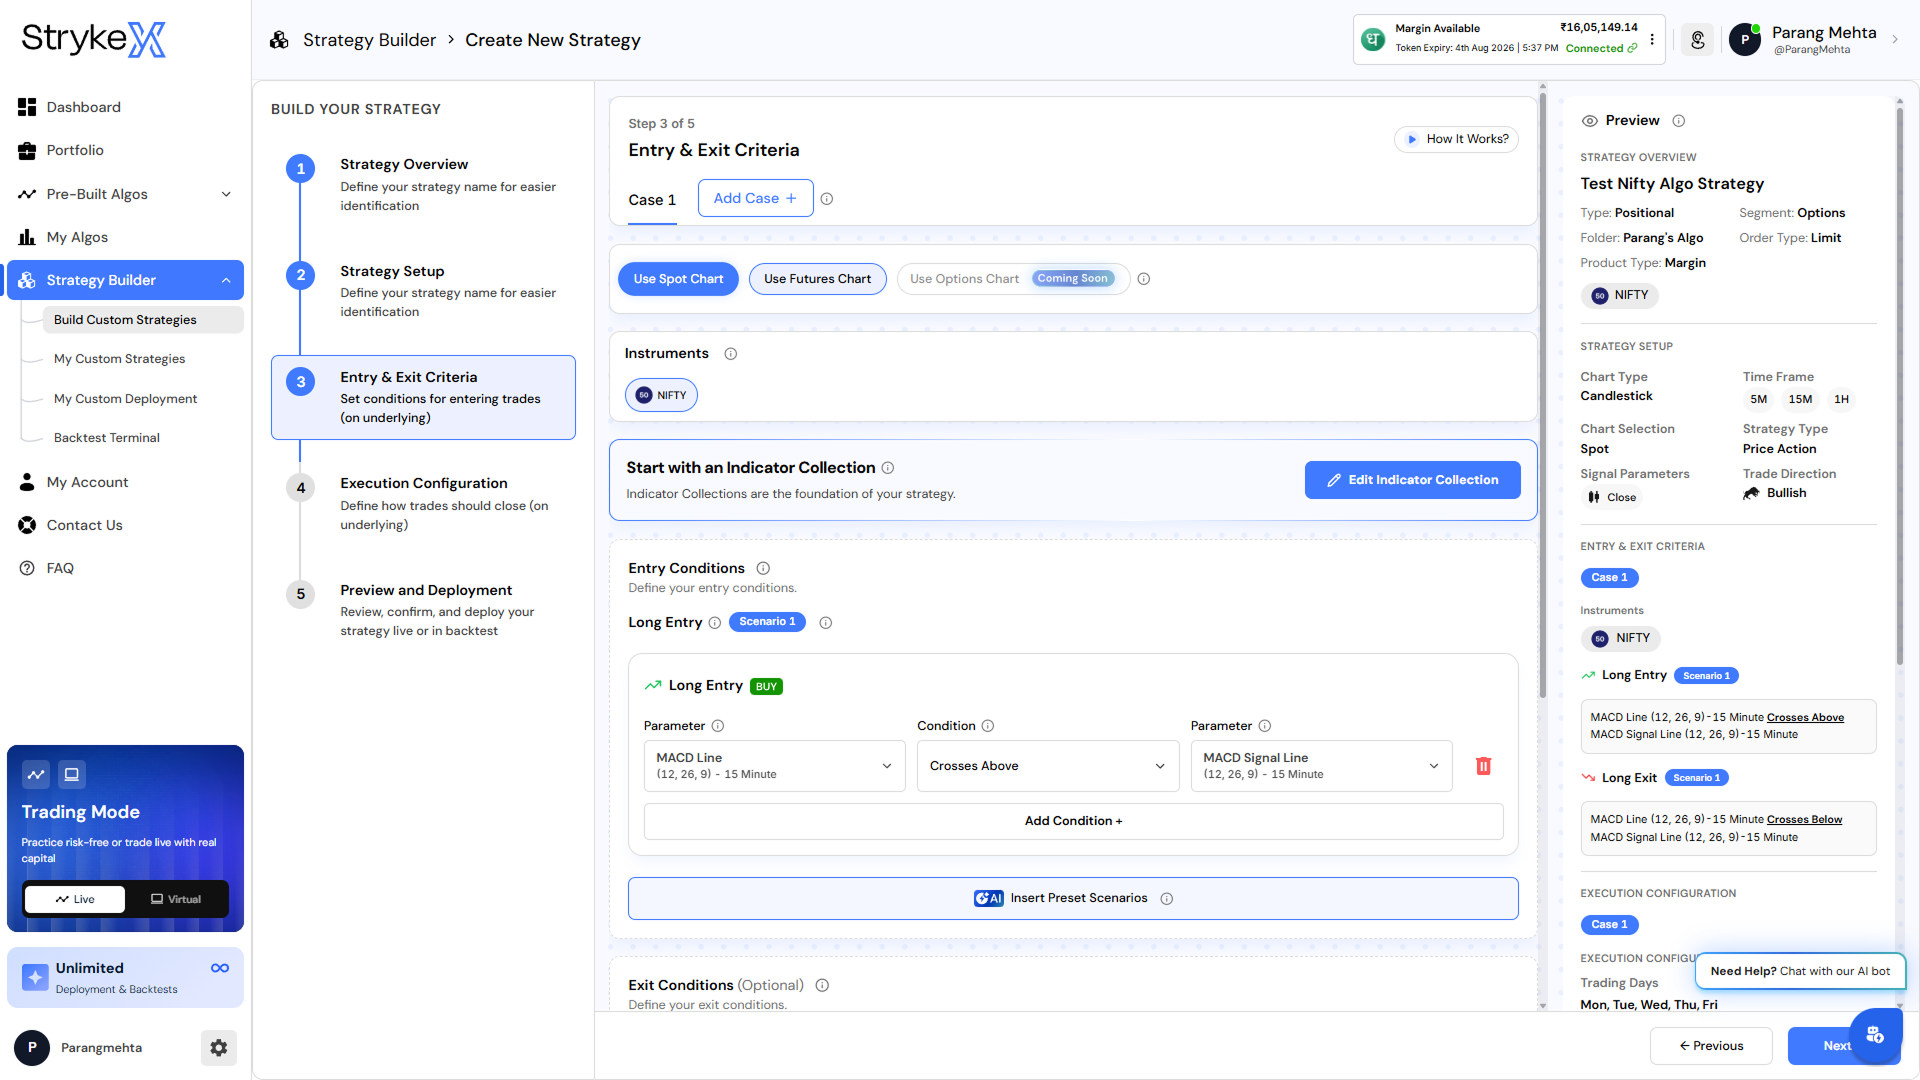
Before writing conditions, you select the indicators you’ll need. For this tutorial we’ll add MACD on the 15-minute timeframe and save it to the collection.
Set the entry condition
We want a momentum entry, so: enter when the MACD line on the 15-minute crosses above the MACD signal line on the 15-minute. You select the MACD line as one output and the signal line as the other, and set the “crosses above” relationship. If you want more logic, click Add Condition and combine with AND / OR.
Use AI preset scenarios (optional)
StrykeX can recommend confirmations based on your entry. Because we’re building a momentum entry, it suggests optional add-ons like a long-term trend confirmation, a VWAP confirmation, an RSI confirmation, or a candlestick pattern. These are optional — use them if they fit your idea.
Set the exit condition
For the exit: exit when the MACD line crosses below the MACD signal line. You can also enable a separate stop-loss and target here in addition to the indicator-based exit. With that, the entry and exit are defined.
Entry & Exit Criteria (The Heart of the Strategy)
Step 4: Execution Configuration (Order Legs & Risk)
Next, decide when and how trades are taken:
- Trading days: all days are selected by default; you can exclude specific days (e.g. skip Thursdays). We’ll trade all days.
- Trading window & outside-window behaviour: control what happens if a signal comes before 9:20 a.m. or an exit comes after 3:25 p.m. (an advanced setting).
- Order leg: we’ll buy one lot of the at-the-money Call option on the monthly expiry.
- Stop-loss / target: set on a percentage, point, or rupee basis; trailing stop-loss, profit targets, and expiry handling are available as advanced options.
Strategy-level risk management
You can also add portfolio-level guardrails: a day-level stop-loss or target, a strategy-level stop-loss, and a cap on the maximum number of transactions per day (say 1, 2, or 3). For this plain-vanilla MACD example we’ll leave these off — but in real trading, these controls matter.
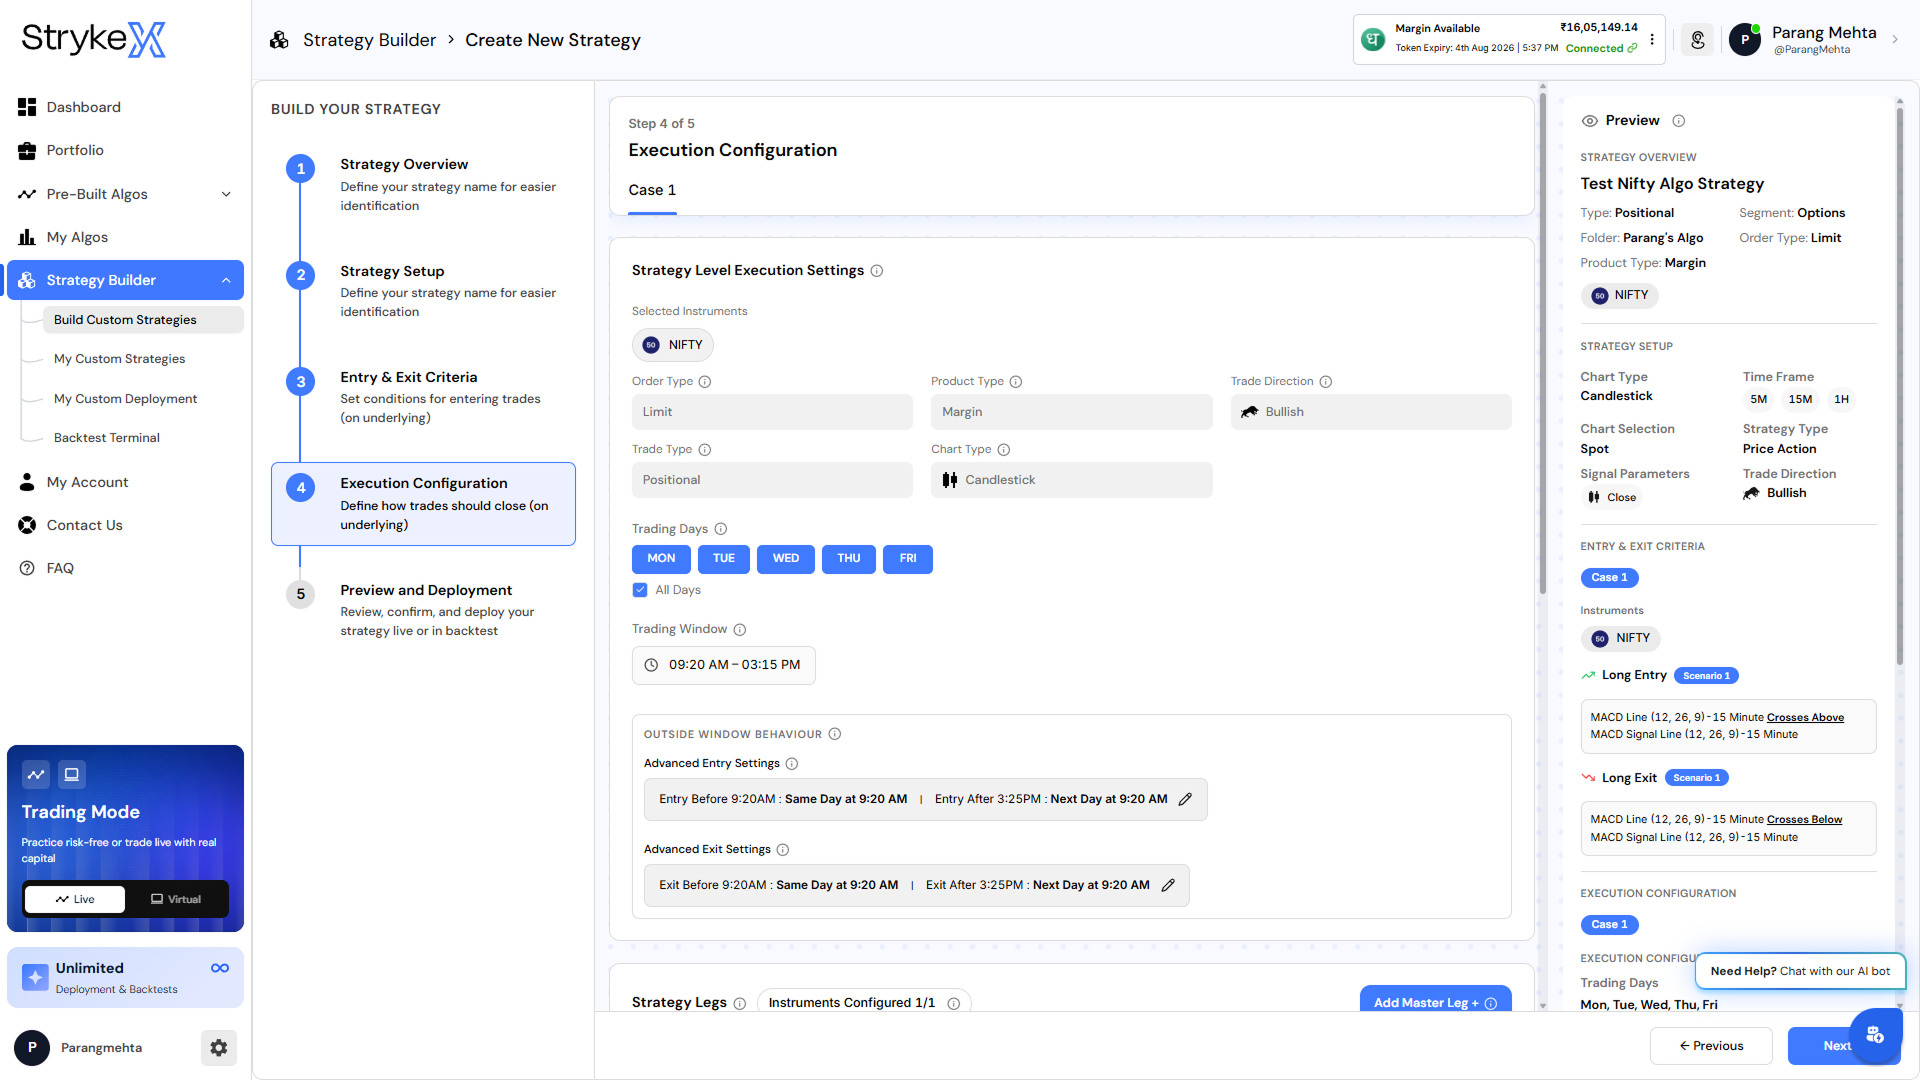
Execution Configuration (Order Legs & Risk)
Step 5: Preview, Backtest & Read the Results
Step 5 shows a summary of everything you’ve built. Click Backtest Strategy and choose a duration — we’ll use the last one year (365 days). It fetches the data and runs, taking roughly 5–15 seconds, then returns a full performance report.
Set realistic capital first
The system auto-detects the estimated capital requirement. For one lot of Nifty the bare-minimum margin is about ₹30,000 — but because options are volatile, we recommend keeping at least ₹1,25,000 per lot for any option strategy, so you can absorb drawdowns and winning/losing streaks. We’ll set capital to ₹1,25,000.
With that, the first backtest of our basic MACD strategy shows:
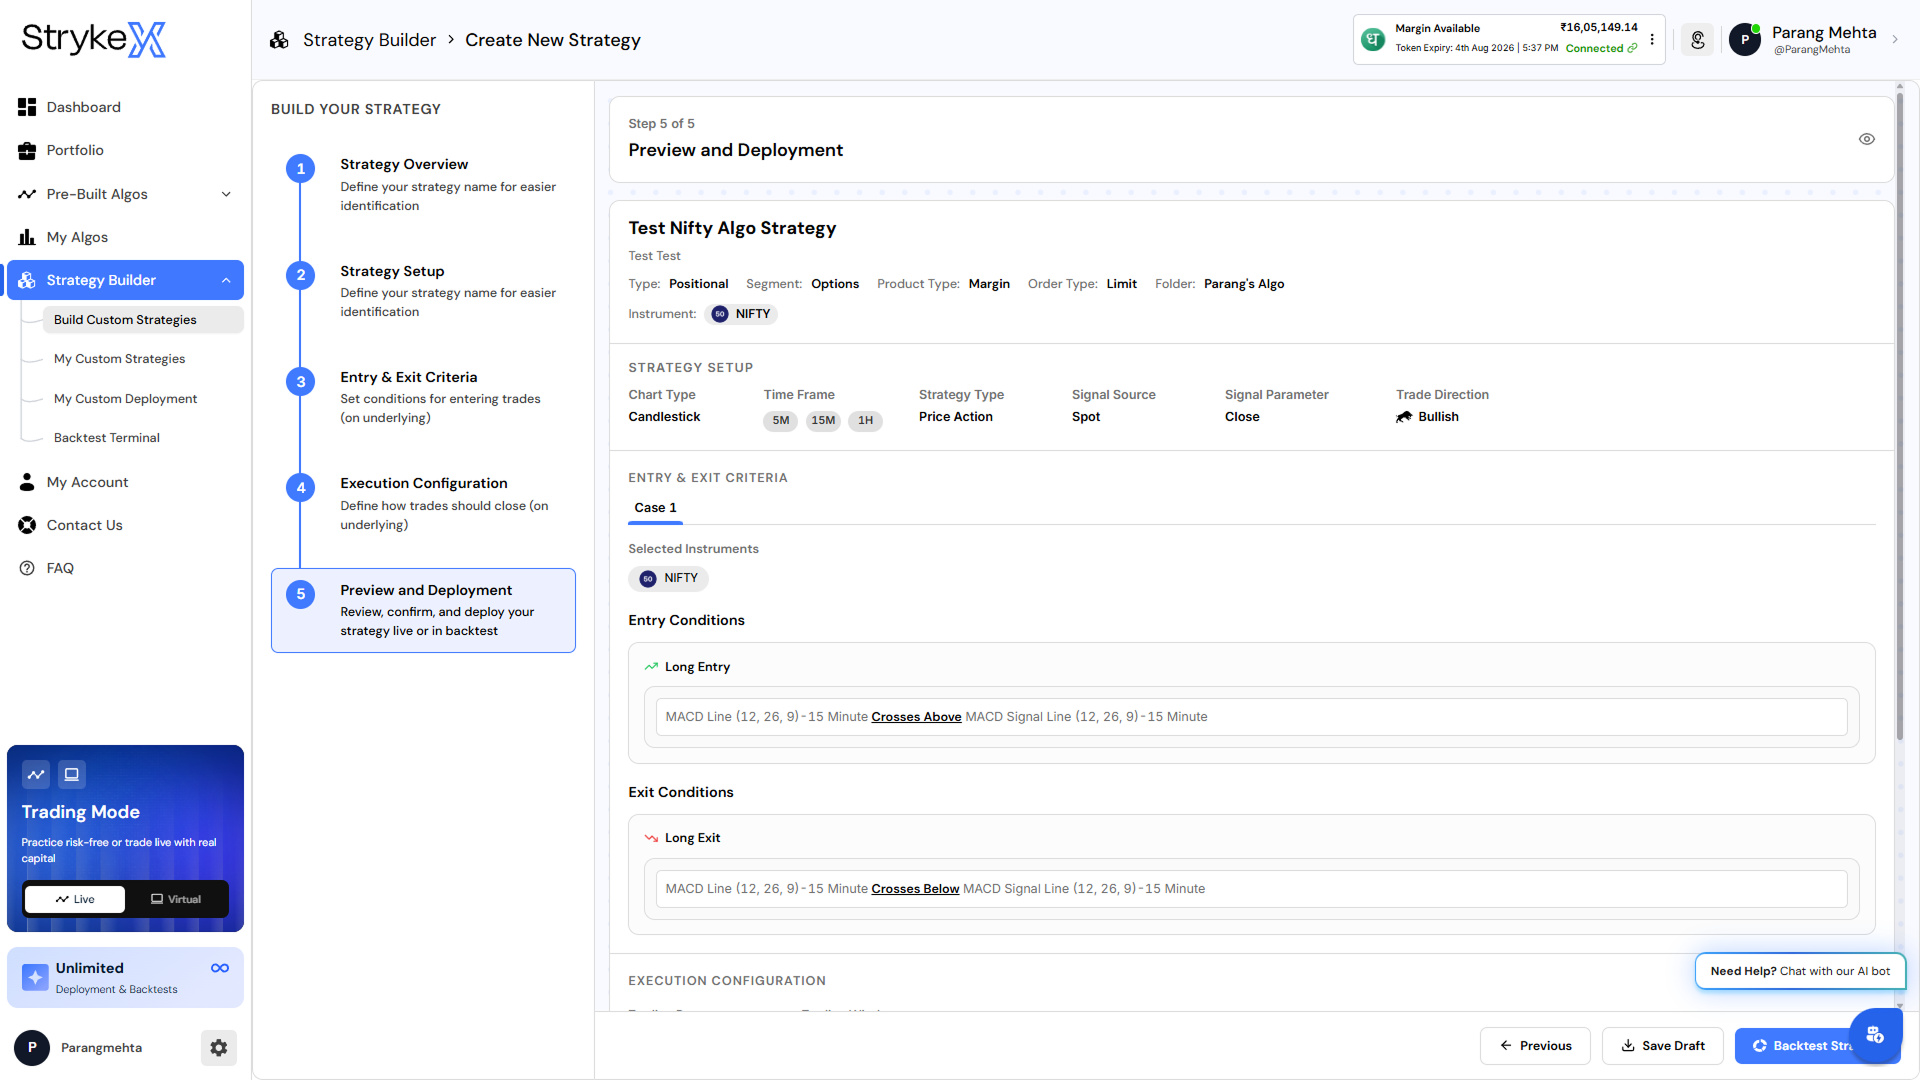
Preview, Backtest & Read the Results
With that, the first backtest of our basic MACD strategy shows:
You also get an equity curve, a month-by-month P&L calendar, insights (most profitable trade, best month, cumulative P&L), and a full transaction history with entry and exit times. So far, so good — but we’re not done, because these numbers aren’t yet realistic.
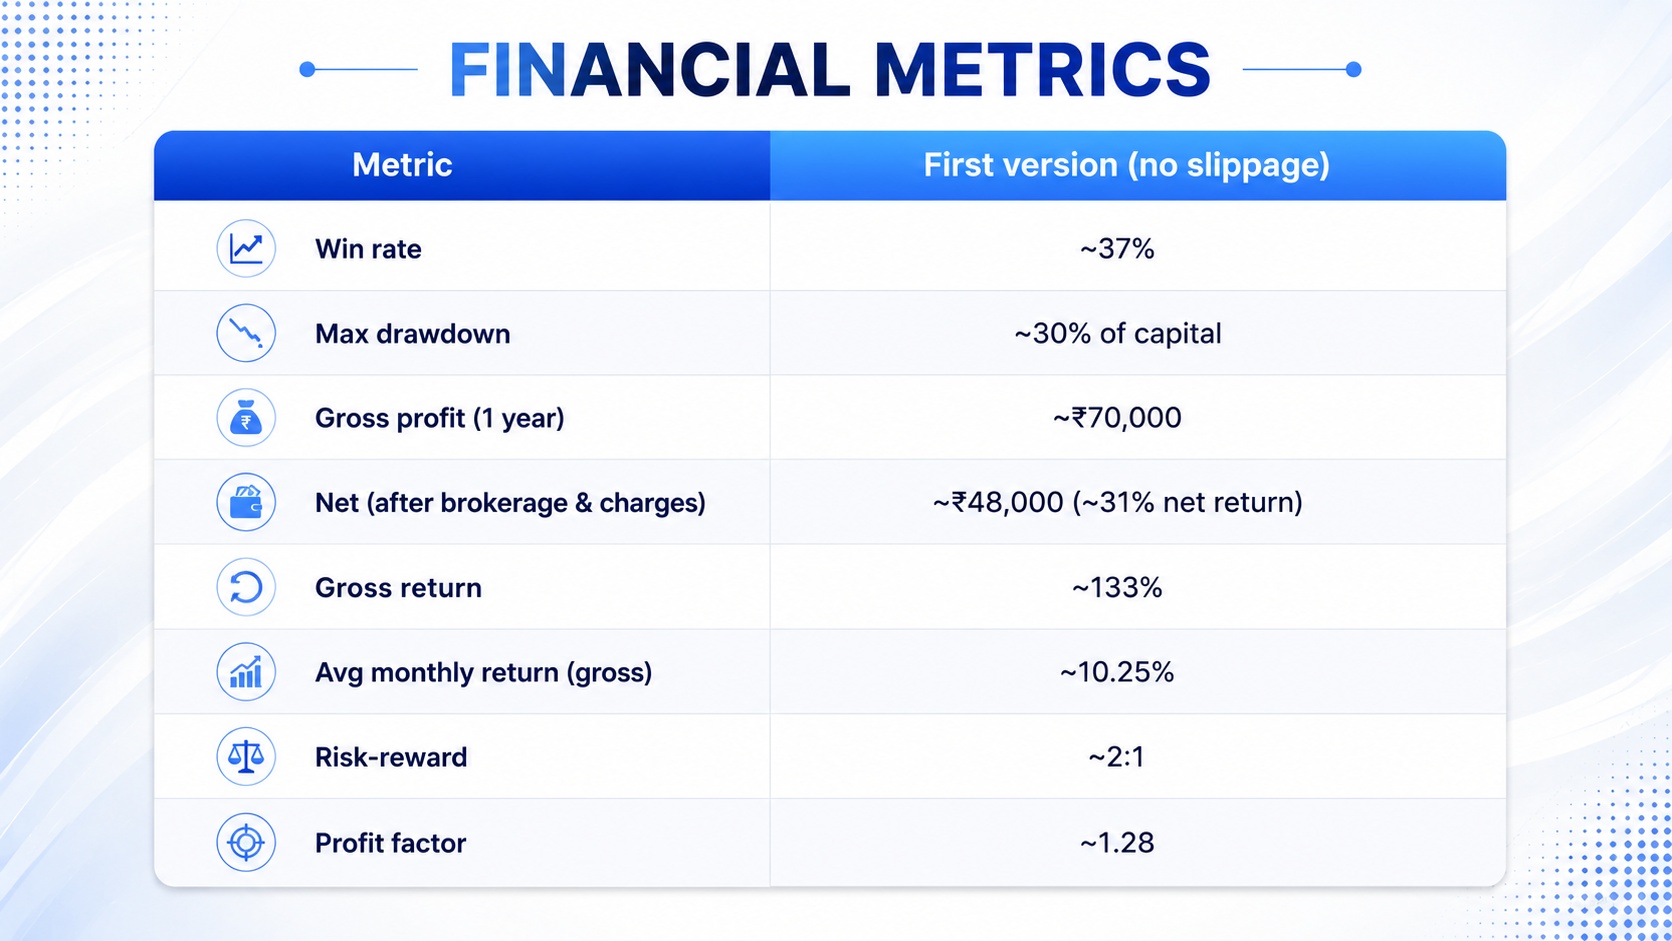
The first backtest of our basic MACD strategy
The Most Important Lesson: Add Slippage
Here’s the step most beginners skip — and it changes everything. Slippage is the difference between the signal price and the actual execution price. For example, a signal might say enter at ₹182 and exit at ₹173.45, but in reality on Nifty you’ll often get filled about ₹2 higher on entry and ₹2 lower on exit.
When you enable slippage and add ₹2 per unit, the builder recalculates: entry becomes ₹184 instead of ₹182, exit becomes ₹171.5 instead of ₹173.5. Because Nifty’s lot size is 65, that’s 65 × ₹2 = ₹130 shaved off each side of every trade. With a high number of trades, this adds up fast.
The result is sobering: after applying ₹2 slippage plus all taxes and charges, our basic strategy’s net profit collapses to just around ₹8,300 for the year, with a much larger drawdown. In other words, a strategy that looked like a 51% return was mostly an illusion once real-world costs were factored in.
Golden rule: Whenever you backtest an options strategy, always add ₹2–₹3 of slippage per unit to see the realistic outcome. A backtest without slippage flatters the strategy and can seriously mislead you.
Refining the Strategy (From 200 Trades to 47)
The basic strategy takes too many trades — and every trade bleeds slippage — so a ~6% return for that much risk doesn’t make sense. Click Edit Strategy and add confirmations to be more selective:
- Add an EMA to the collection — e.g. the 21 EMA and 50 EMA on the 5-minute.
- Add a trend confirmation — for example, using an AI-generated insight to only take the trade if the Supertrend is bullish.
- Tighten the exit — e.g. exit if the current candle closes below the 50 EMA.
Now the entry requires the MACD cross AND the trend confirmation, so far fewer, higher-quality trades fire. Re-run the same one-year backtest and the difference is dramatic:
Key takeaway: Your first version is rarely your best. Refining to take fewer, higher-conviction trades often beats a high-frequency version once slippage and costs are included.
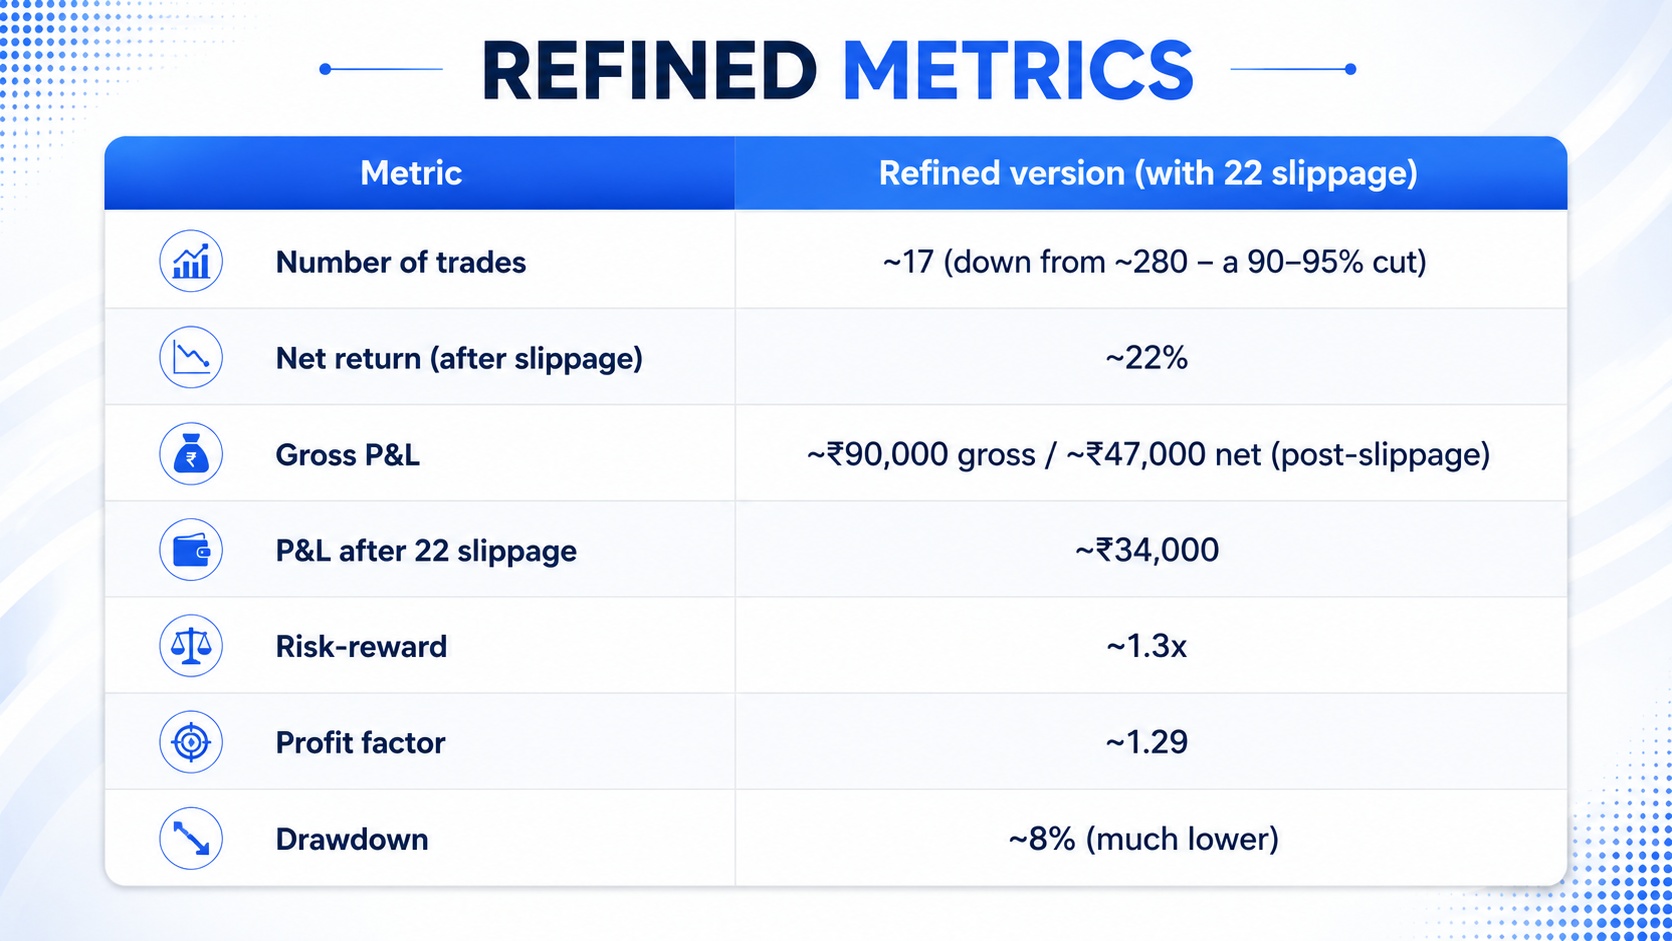
Fewer trades means less slippage, a better risk-reward (3.5x), a stronger profit factor (1.82), and a far smaller drawdown. The monthly calendar shows small losses in weak months offset by big winners when markets trended (like April 2026). This is now a genuinely better strategy — and it survived realistic costs.
Deploying Your Strategy
Happy with the refined strategy, we deploy it in virtual mode first — click Deploy Virtual, agree to the terms, and confirm. This runs the strategy in live market conditions without real money, so you can see how it actually behaves before risking capital. You can also duplicate a strategy, view its details, and find everything under My Custom Strategies.
The Backtest Terminal then lets you compare versions side by side — version one vs version two — on profit factor, drawdown, and ROI. In our case, version two clearly wins: a lower ~9% drawdown and a higher profit factor. (Remember ROI shown at gross level changes once slippage is applied — always judge on realistic numbers.)
Get Started
That’s the whole workflow: build, backtest, add slippage, refine, and deploy — no coding needed. Want to try it yourself? See StrykeX plans and pricing here to get started with the Strategy Builder. Prefer to learn first? Join our free community here for more tutorials and strategy breakdowns.
Frequently asked questions
Can I build an algo strategy without coding on StrykeX?
Yes. The StrykeX Strategy Builder is fully no-code — you select indicators, set entry and exit conditions visually, configure risk, then backtest and deploy. There are also AI-powered and template-based options to start even faster.
What is slippage and why does it matter in backtesting?
Slippage is the difference between the signal price and the actual execution price. On Nifty options it can be around ₹2 per unit each way. Always add ₹2–₹3 of slippage in your backtest, because ignoring it makes a strategy look far more profitable than it really is.
How much capital do I need for an options algo strategy?
While the bare-minimum margin for one lot of Nifty is around ₹30,000, StrykeX recommends keeping at least ₹1,25,000 per lot for options strategies, because options are volatile and you need enough capital to absorb drawdowns and losing streaks.
What is virtual deployment on StrykeX?
Virtual deployment runs your strategy in live market conditions without using real money, so you can see how it performs before going live. It’s a safe way to validate a strategy. Learn more in our how StrykeX works guide.
Is a higher win rate always better?
Not necessarily. A strategy with fewer, higher-quality trades and a strong risk-reward and profit factor can outperform a high-win-rate strategy that takes many trades and loses more to slippage and costs. Judge on net, realistic results.
Does StrykeX guarantee profits from these strategies?
No. No strategy or platform can guarantee profits — all trading carries market risk. Backtested results are not a promise of future performance. Always test with realistic slippage and use strict risk management. See our StrykeX review.
StrykeX — By Stockwiz Technologies