Supertrend Indicator Strategy
Supertrend Indicator Strategy: Rules, Settings & How to Automate It
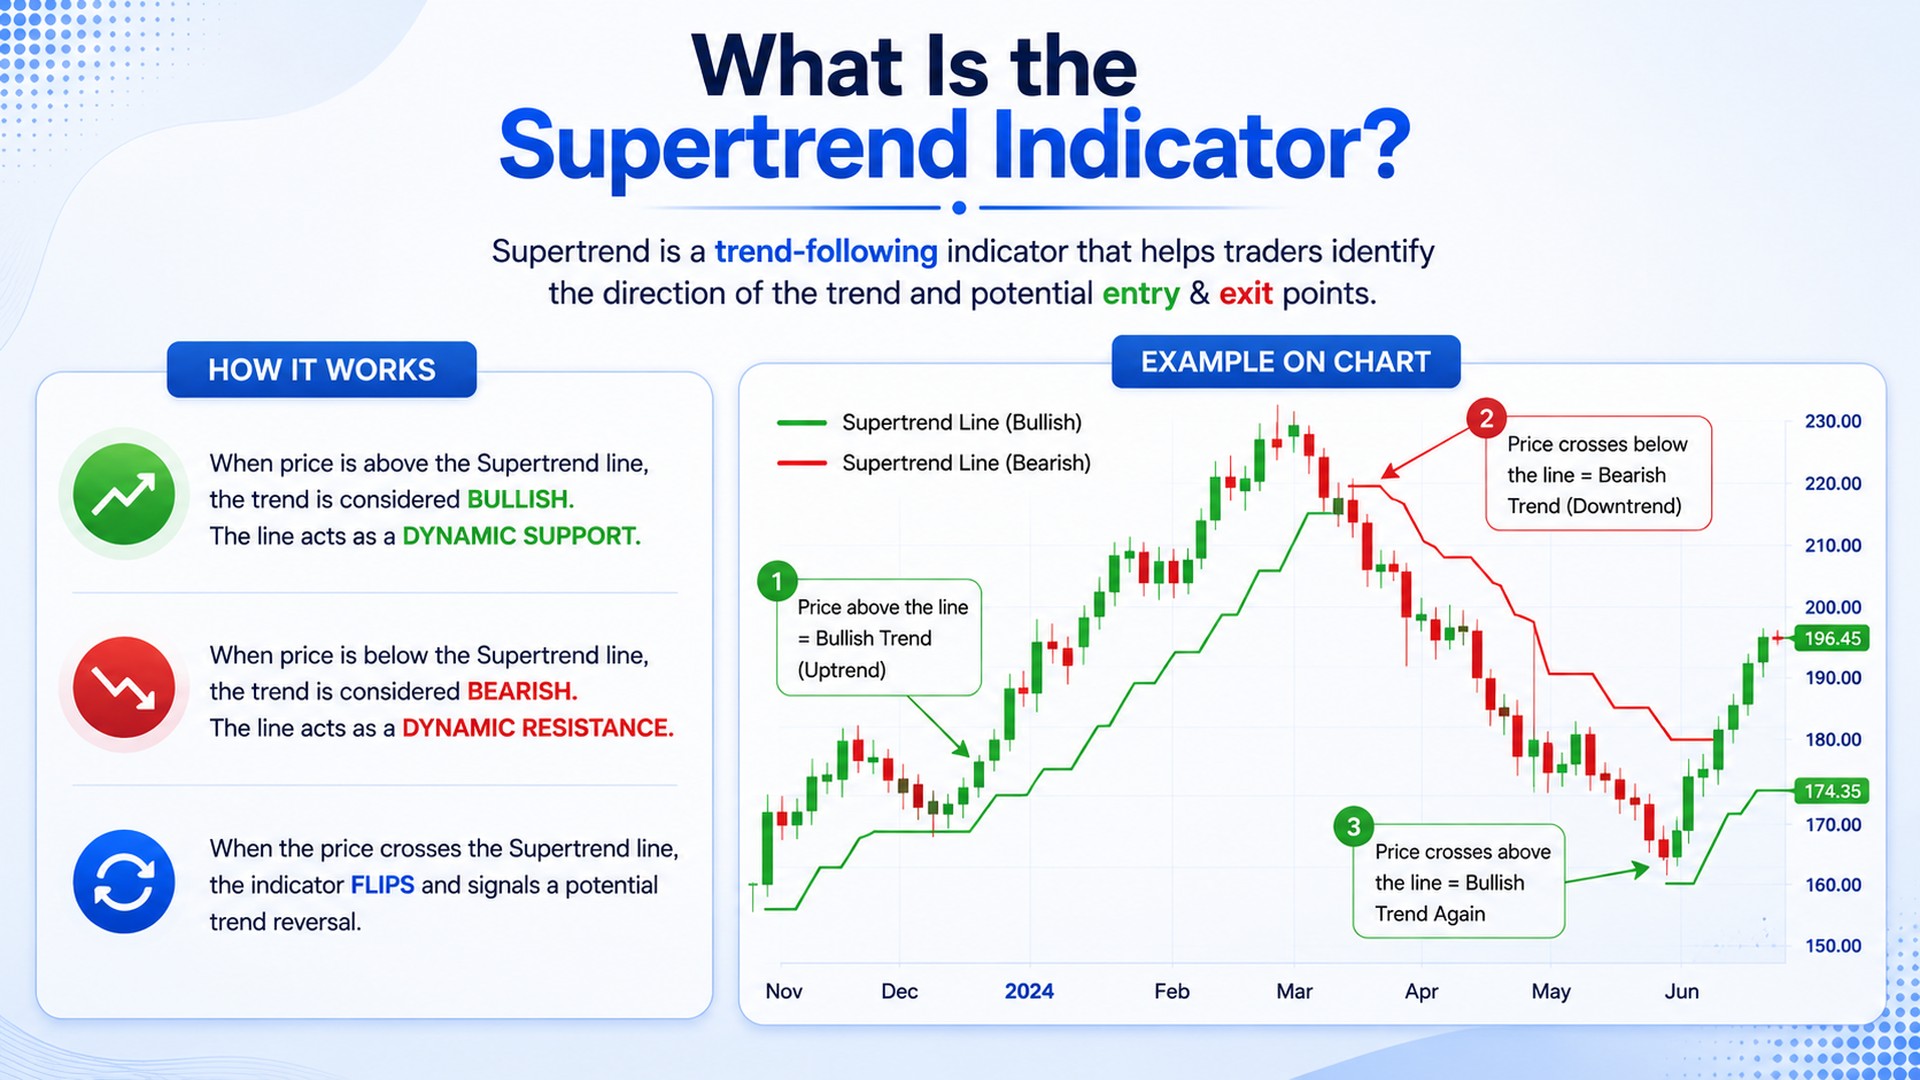
The Supertrend indicator strategy is a trend-following method that uses one line plotted from the Average True Range (ATR) to signal direction. When price closes above the Supertrend line it turns green (uptrend, potential buy); when price closes below it turns red (downtrend, potential sell).
Supertrend Indicator Strategy: Rules, Settings & How to Automate It
The Supertrend indicator strategy is a trend-following method that uses one line plotted from the Average True Range (ATR) to signal direction. When price closes above the Supertrend line it turns green (uptrend, potential buy); when price closes below it turns red (downtrend, potential sell). The most common settings are an ATR period of 10 and a multiplier of 3. It works best in trending markets, struggles in sideways ones, and can be fully automated so the rules execute without emotion.
If you have ever stared at a chart wondering whether you are in an uptrend or just kidding yourself, the Supertrend indicator was practically built for that moment. It is one of the few indicators that gives you a single, no-nonsense answer: green means the trend is up, red means it is down. No tangle of lines, no second-guessing.
That simplicity is exactly why the Supertrend indicator strategy has become a favourite among Indian intraday and swing traders. But “simple” does not mean “foolproof.” Used blindly, Supertrend will whipsaw you to death in a sideways market. Used with the right settings, clear rules, and a bit of discipline, it can be genuinely useful. This guide walks through how it works, the settings that matter, the buy and sell rules, the mistakes that quietly drain accounts, and how to automate the whole thing.
What Is the Supertrend Indicator?
The Supertrend indicator is a trend-following overlay that plots a single line directly on your price chart. Developed by Olivier Seban, it has one job: tell you the current direction of the trend and roughly where a sensible stop-loss could sit. When the line is below the candles and green, the market is in an uptrend. When it flips above the candles and turns red, the trend is down.
What makes it tick is the Average True Range (ATR) — a measure of how much an instrument typically moves in a given period. Because Supertrend is built on ATR, it adapts to volatility: it gives a fast-moving stock more breathing room and keeps a calm one on a tighter leash. That volatility-awareness is the quiet genius of the indicator.
In one sentence: Supertrend = price direction + a volatility-based trailing line, drawn as a single colour-coded line you can read in half a second.
What Is the Supertrend Indicator?
How the Supertrend Indicator Works (Formula, Simplified)
You do not need to compute this by hand — every charting platform does it — but understanding the logic helps you trust the signals instead of blindly following a colour.
1. Find the midpoint of each candle: (High + Low) ÷ 2.
2. Calculate the ATR over your chosen period (commonly 10 candles).
3. Upper band = midpoint + (multiplier × ATR). Lower band = midpoint − (multiplier × ATR).
4. The line follows the lower band in an uptrend and the upper band in a downtrend, flipping only when price closes through it.
The key word is closes. Supertrend only flips on a candle close beyond the line, not on a brief intra-candle spike. That single design choice filters out a lot of noise.
Best Supertrend Settings (ATR Period & Multiplier)
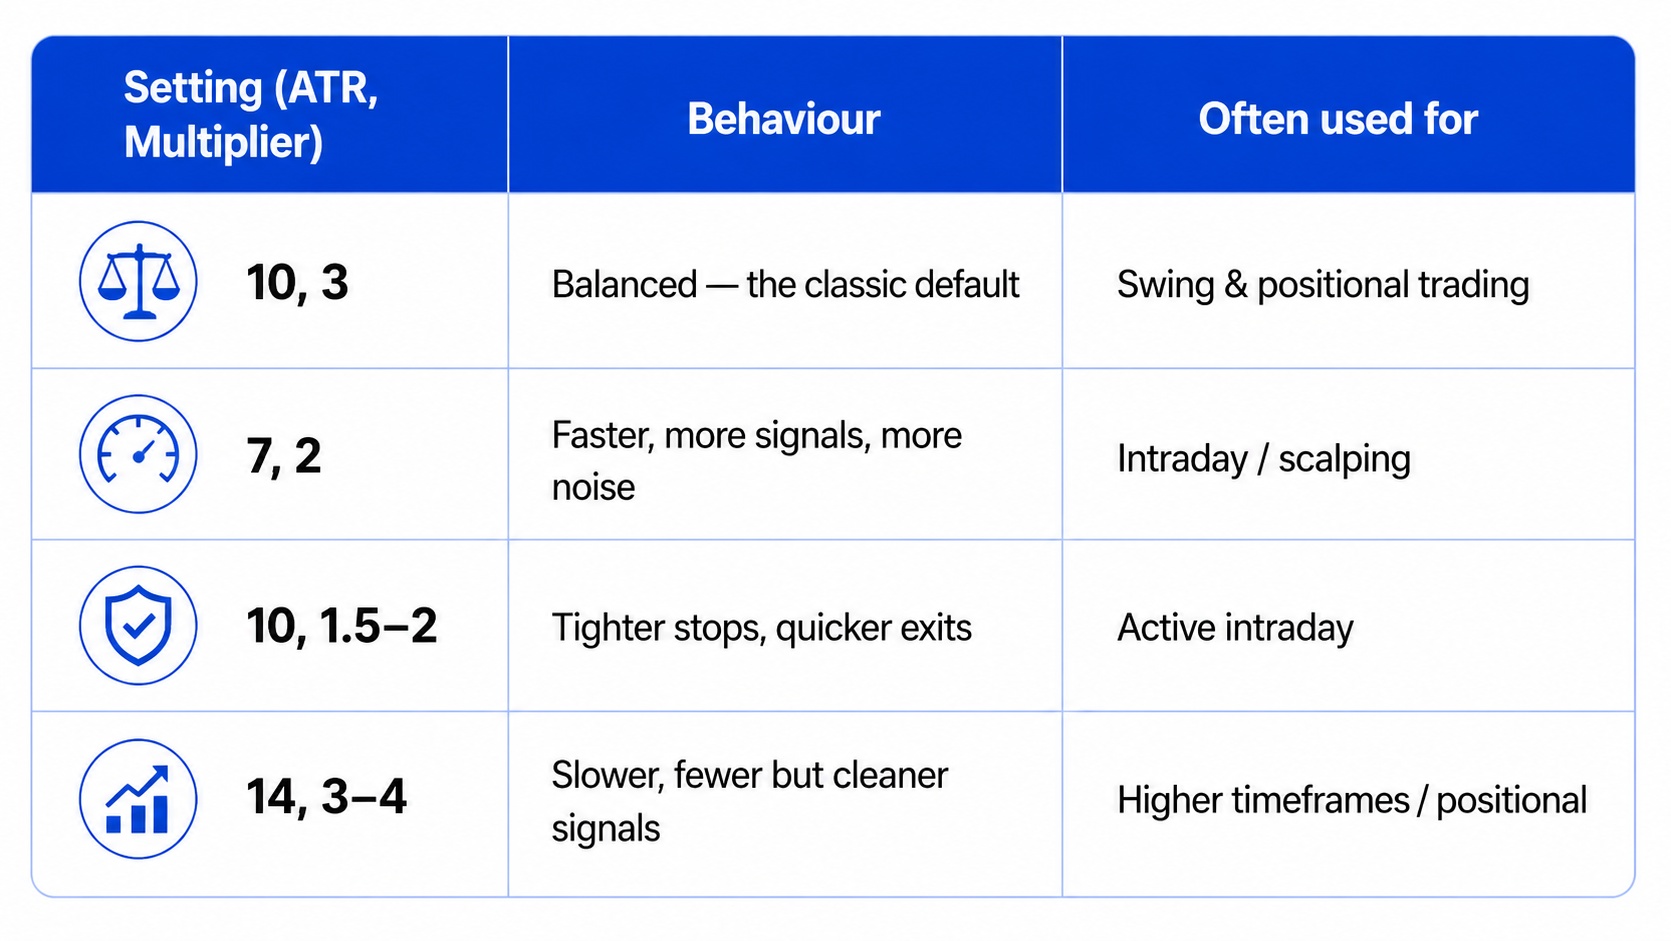
There is no single “magic” setting. The right numbers depend on your timeframe, the instrument, and how much noise you tolerate. Here are common starting points and what each does.
The trade-off is always the same: a lower multiplier reacts faster but whipsaws more; a higher multiplier gives fewer, more reliable signals but enters and exits later. Start with 10 and 3, then adjust only after testing. Resist endless “optimising” — a setting that looks perfect on past data often falls apart live, a trap known as curve-fitting.
Best Supertrend Settings (ATR Period & Multiplier)
Supertrend Strategy Rules: Entry, Exit & Stop-Loss
The rules are unambiguous — which is what makes them automatable. Treat this as an educational template, not a personalised recommendation.
Buy (long) rules
• Entry: Enter long when a candle closes above the Supertrend line and it turns green.
• Stop-loss: Place the stop at the Supertrend line — it trails upward as the trend continues.
• Exit: Exit when price closes back below the line and it flips red.
Sell (short) rules
• Entry: Enter short when a candle closes below the Supertrend line and it turns red.
• Stop-loss: Place the stop at the line, trailing downward.
• Exit: Exit when price closes back above the line and it flips green.
The indicator doubles as your trailing stop-loss — entry, trailing stop, and exit all come from one line. For more on how disciplined exits protect capital, see how StrykeX works.
Why You Should Rarely Trade Supertrend Alone
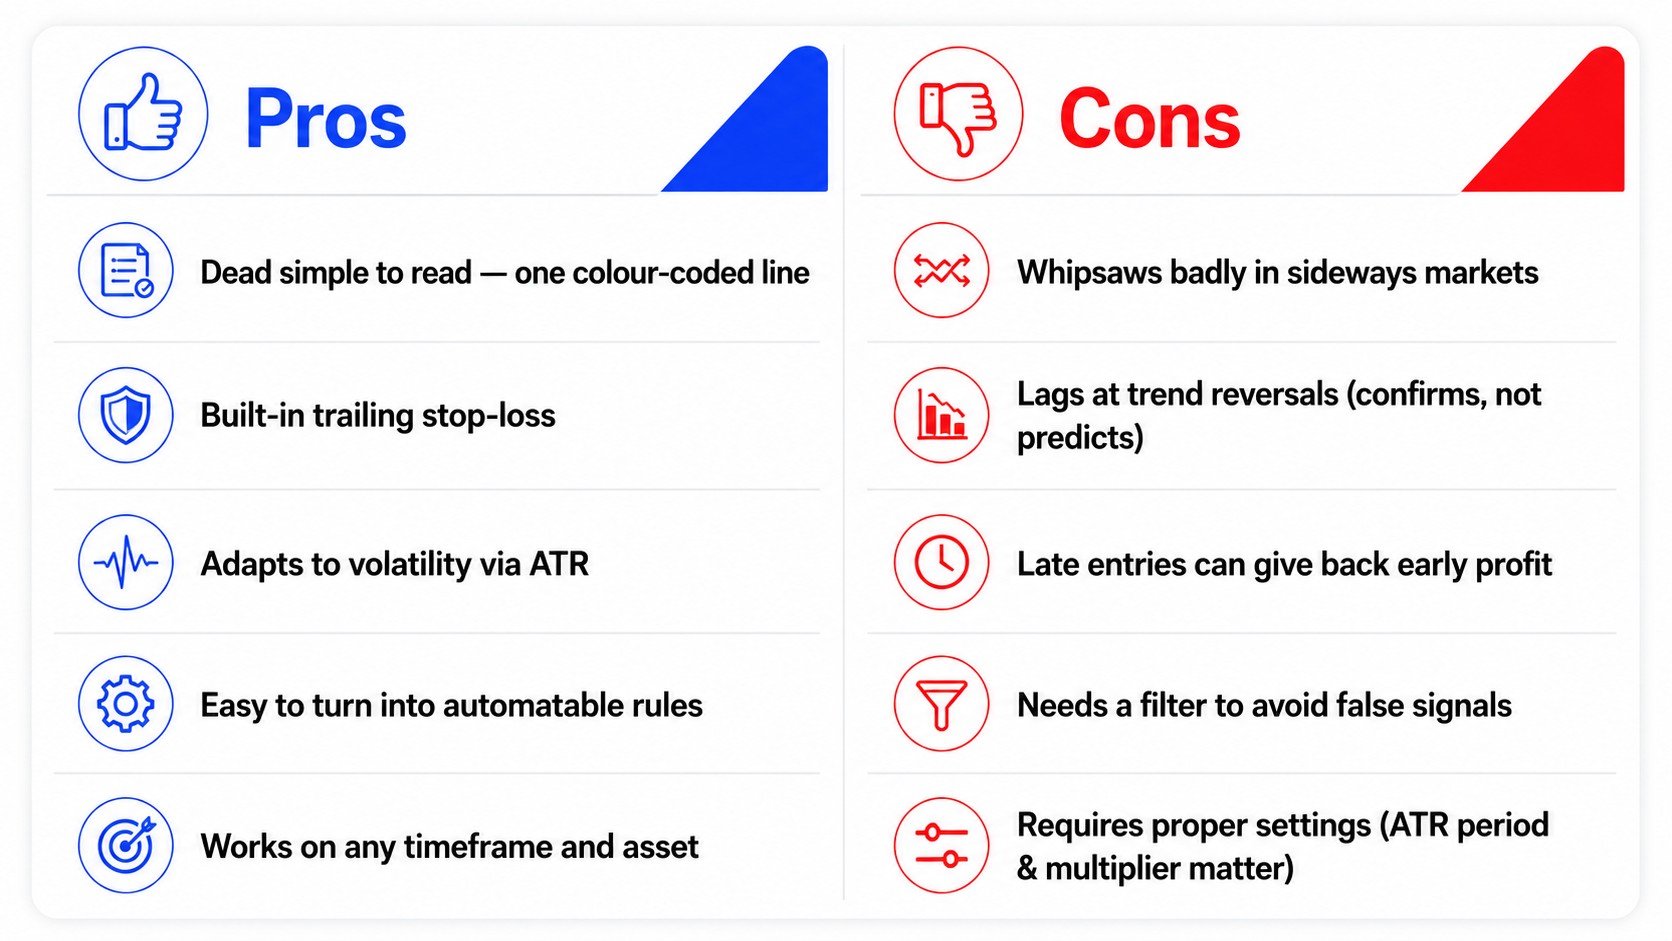
On its own, Supertrend is a lagging tool that gets chopped up in sideways markets. The fix is to pair it with one filter that confirms whether a trend actually exists — not five, which just creates conflicting signals.
• Moving average (50/200 EMA): take buys only when price is above the average, sells only when below.
• RSI: avoid entering when a move is already badly overstretched.
• ADX: trade signals only when ADX shows the market is actually trending.
Pros and Cons of the Supertrend Strategy
Pros and Cons of the Supertrend Strategy
Common Supertrend Mistakes (and How to Avoid Them)
1. Trading every flip. In sideways markets it flips constantly. Use a trend filter and sit out choppy phases.
2. Ignoring the candle close. Acting on an intra-candle touch produces fake signals.
3. Over-optimising settings. Tuning numbers until past results look perfect rarely survives live markets.
4. Skipping the stop-loss. The line is your stop — overriding it removes the strategy’s main risk control.
5. Risking too much per trade. Even a good signal can fail. Size positions so one loss never threatens your account.
Key takeaway: Most Supertrend losses come from using it in the wrong market (sideways) or ignoring its own stop-loss — not from the indicator being “bad.”
How to Automate the Supertrend Strategy
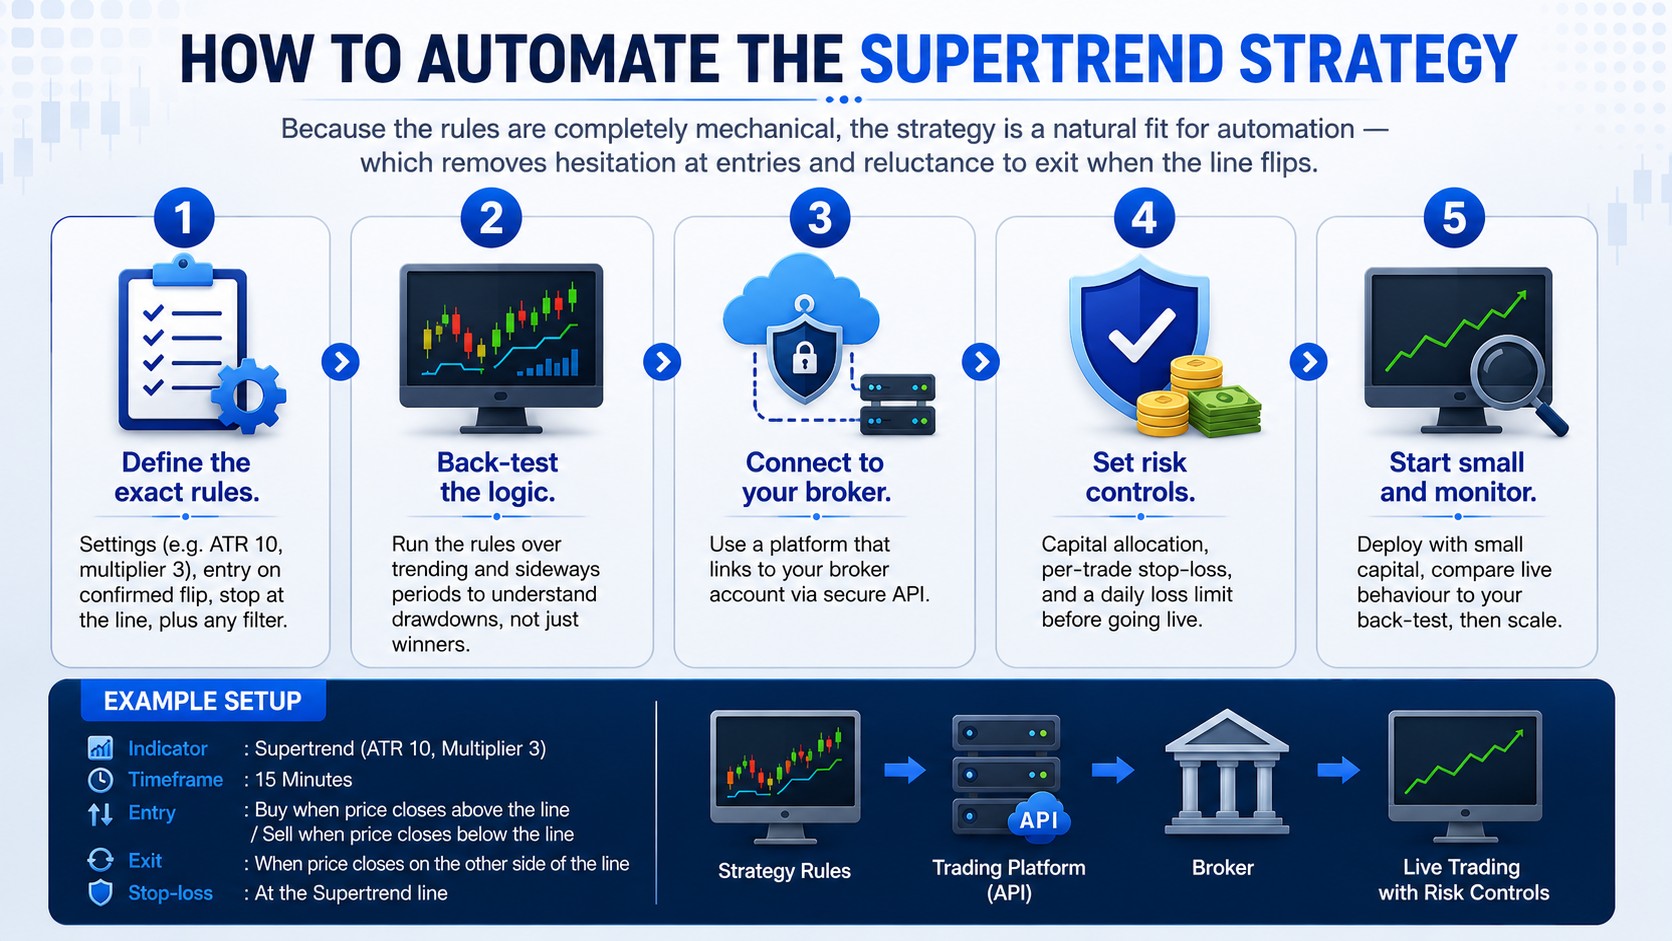
Because the rules are completely mechanical, the strategy is a natural fit for automation — which removes hesitation at entries and reluctance to exit when the line flips. The general path:
1. Define the exact rules. Settings (e.g. ATR 10, multiplier 3), entry on confirmed flip, stop at the line, plus any filter.
2. Back-test the logic. Run the rules over trending and sideways periods to understand drawdowns, not just winners.
3. Connect to your broker. Use a platform that links to your broker account via secure API.
4. Set risk controls. Capital allocation, per-trade stop-loss, and a daily loss limit before going live.
5. Start small and monitor. Deploy with small capital, compare live behaviour to your back-test, then scale.
This is exactly the kind of rule-based logic algorithmic platforms are built for. StrykeX, for example, lets you deploy rule-based strategies that connect to your own broker account and execute automatically, with layered risk controls — while your funds stay in your own account. See our complete StrykeX review and is StrykeX safe guides.
Important: Automation enforces discipline; it does not guarantee profit. A poor strategy automated is still a poor strategy — and all trading carries market risk, including the risk of loss.
Final Thoughts
The Supertrend indicator earns its popularity honestly: it is simple, readable, volatility-aware, and it hands you an entry, a trailing stop, and an exit from a single line. But it is a trend-following tool, so it shines when there is a trend and suffers when there is not. Add a confirmation filter, respect the stop-loss, size positions sensibly, and consider automating the rules so emotion stays out of it. No indicator removes market risk, and no setting guarantees a winning trade.
Related Articles
• StrykeX Review (2026): Features, Performance & Safety
• How StrykeX Works: A Step-by-Step Guide
• Can You Do Algo Trading Without Coding? (Yes — Here’s How)
Frequently asked questions
What is the best Supertrend setting for intraday trading?
Many intraday traders start with ATR 7 and multiplier 2 for faster signals, or stick with 10 and 3 for fewer false flips. There is no universally best setting — test it on your instrument and timeframe first.
Is the Supertrend indicator good for beginners?
Yes, because it gives a single, easy-to-read signal and a built-in trailing stop-loss. Beginners should pair it with a trend filter and strict position-sizing and avoid sideways markets.
Does the Supertrend strategy work in sideways markets?
No — that is its main weakness. In choppy markets it flips repeatedly and produces whipsaw losses. It performs best in clearly trending markets, so a filter like ADX helps.
Can the Supertrend strategy be automated?
Yes. Its rules are fully mechanical, so it can be coded and run automatically through a platform that connects to your broker via API. See how StrykeX works.
What is the default Supertrend setting?
The most common default is ATR 10 and multiplier 3 — a balanced mix of responsiveness and reliability, and a sensible starting point.
Should I use Supertrend with other indicators?
Usually yes. On its own it is prone to false signals, so most traders add one confirming filter such as a moving average, RSI, or ADX.
Does Supertrend repaint?
No, standard Supertrend does not repaint once a candle closes. Just avoid acting on an unconfirmed, still-forming candle.
StrykeX — By Stockwiz Technologies