StrykeX Live Results vs Backtest: How to Verify Every Trade
StrykeX Live Results vs Backtest: How to Verify Every Trade
Why StrykeX live results can differ from a backtest or screenshot: slippage, costs and timing, plus a six-step check against your broker statement.
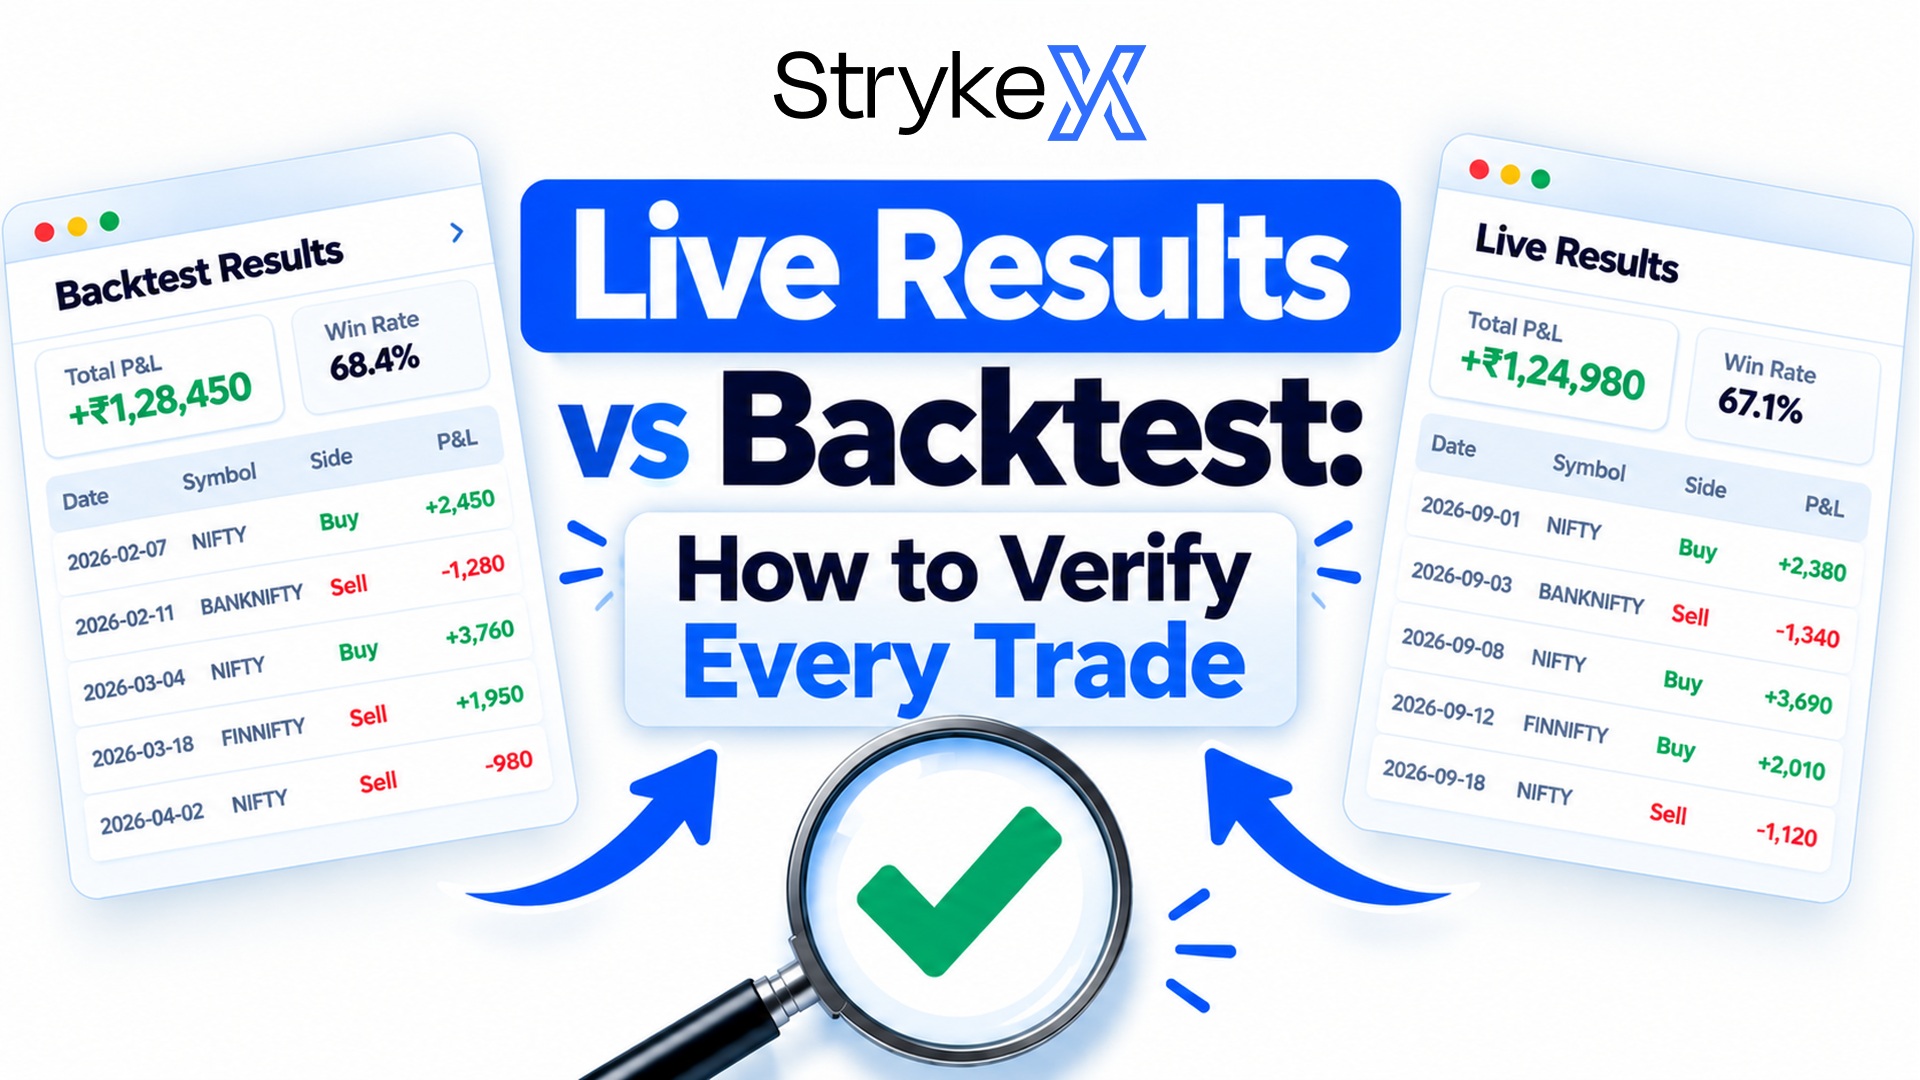
StrykeX Live Results vs Backtest: How to Verify Every Trade Against Your Broker Statement
Quick answer
• A backtest replays history with ideal fills. Live trading adds slippage, delays, charges and brokerage, so live results are usually lower than a backtest.
• A high win rate does not mean profit. A strategy can win often and still lose money if its losses are larger than its wins.
• On the StrykeX P&L screen, Net P&L is shown after charges and brokerage. The plan fee is not included in that figure.
• You can reconcile any live day in six steps: export the broker tradebook, match each order, measure slippage, add charges and compare totals.
Live results differ from a backtest because a backtest assumes perfect fills, while live orders meet spreads, delays and charges. On StrykeX, Net P&L is shown after charges and brokerage. This guide explains why the numbers differ and gives a six-step check against your broker statement.
Why do StrykeX live results differ from a backtest?
A backtest is a simulation. It replays past prices and assumes each order filled at the price your rules wanted. That is why backtest results are labelled hypothetical, and why every backtest shown by any platform, including StrykeX, should be read as a simulation.
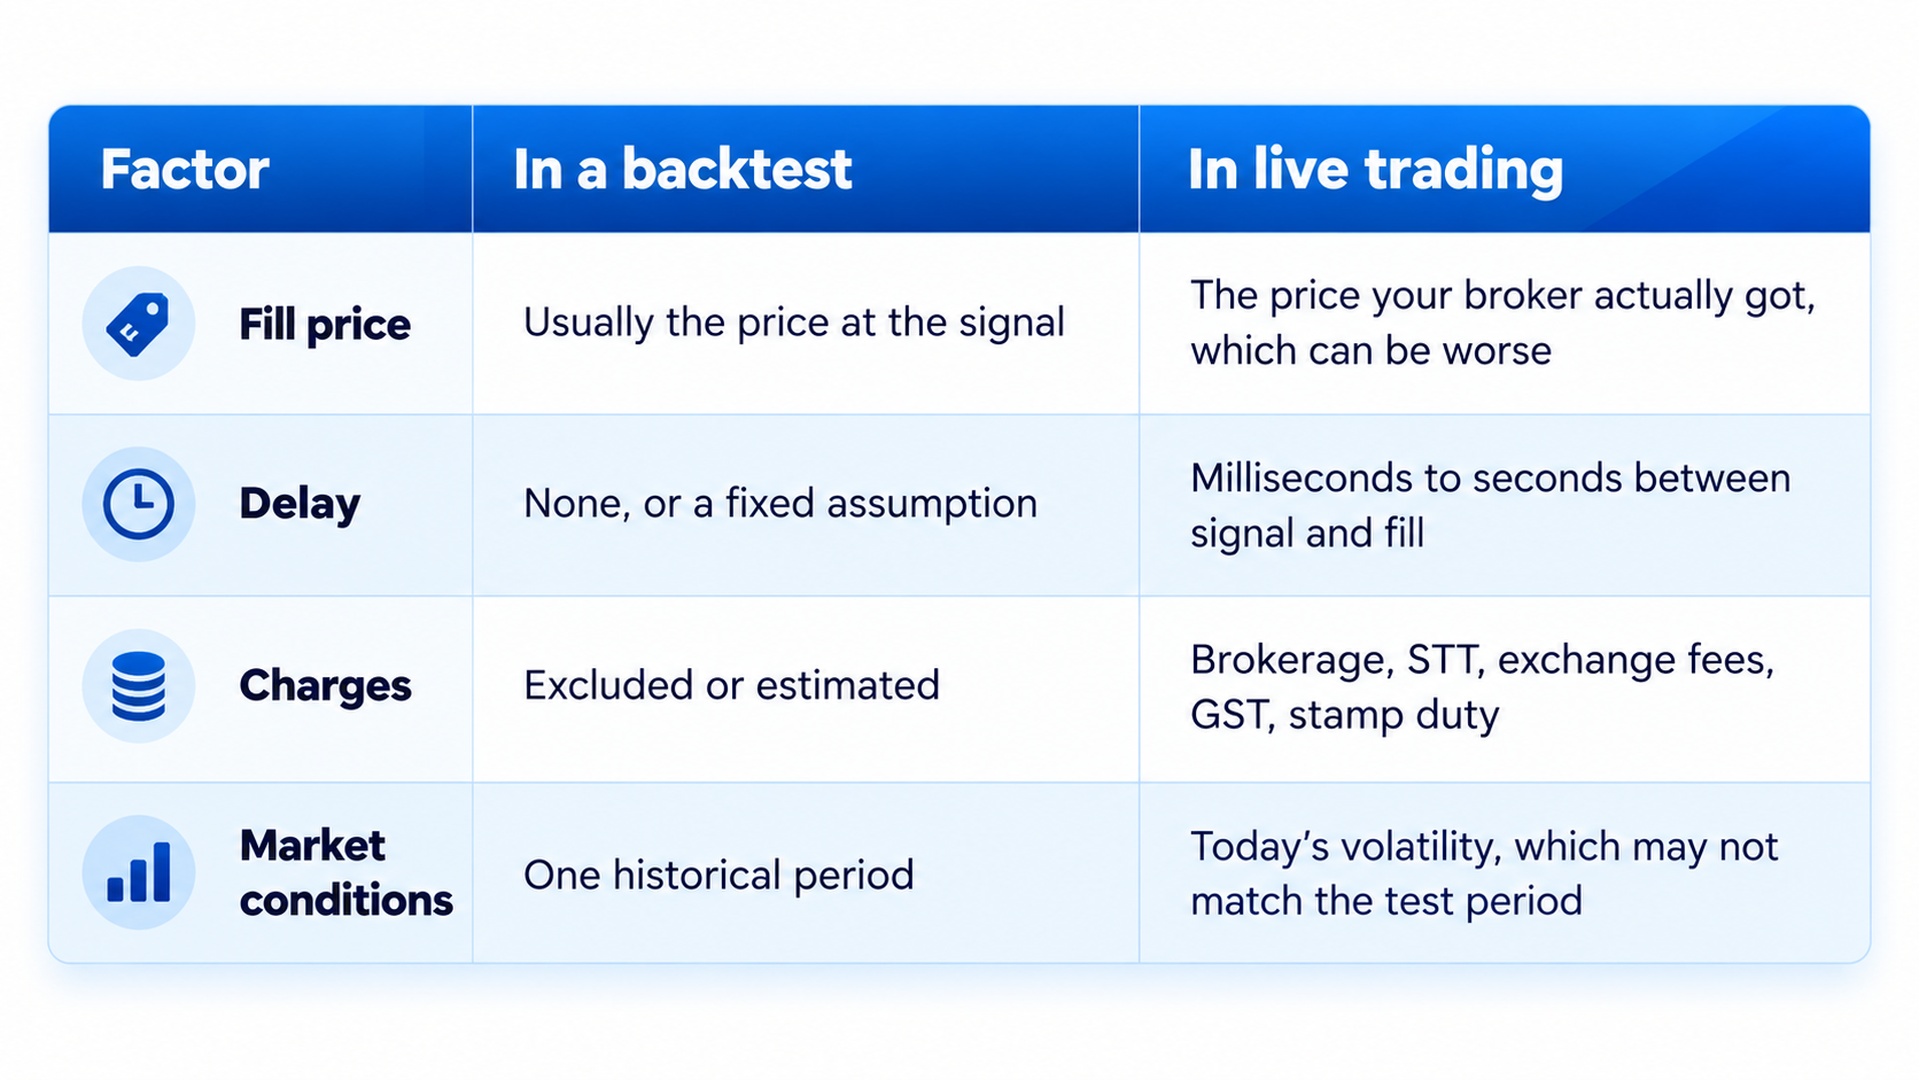
Live trading adds four things the simulation leaves out or estimates.
Why do StrykeX live results differ from a backtest?
What does a win-rate screenshot really tell you?
A win rate is the share of trades that closed in profit. It says nothing on its own about how large the wins and losses were. A reviewer seeing a screenshot with a high win rate may expect steady profit, but that is not what the number means.
Here is a hypothetical example. Strategy X wins 8 trades in 10 with an average gain of ₹500. It loses 2 trades with an average loss of ₹3,000. Net result: 8 × ₹500 = ₹4,000 won, 2 × ₹3,000 = ₹6,000 lost, so ₹2,000 lost overall despite an 80% win rate. Strategy Y wins only 4 in 10 but gains ₹2,000 on average and loses ₹800 on average: ₹8,000 won, 6 × ₹800 = ₹4,800 lost, ₹3,200 net gain. This is a hypothetical example, not a StrykeX result.
So treat a win rate as one number among several. Ask for drawdown, average win, average loss and number of trades too. For this reason StrykeX does not advertise accuracy percentages as a promise.
What is slippage, and how much can it matter?
Slippage is the difference between the price your strategy expected and the price you got. It is larger for fast strategies, illiquid strikes and volatile minutes, such as just after market open or a news event.
Here is a hypothetical example to show the arithmetic. Assume an options strategy trades a quantity of 100 and each trade has 4 orders (two entries and two exits). If each order slips by ₹0.50, that costs 100 × ₹0.50 × 4 = ₹200 per trade. Over 20 trades a month, that is ₹4,000. If the strategy's average gain per trade was ₹300, slippage takes away two-thirds of it. Small gaps add up quickly when the margin per trade is thin.
Why can a dashboard differ from your broker statement?
A dashboard and a broker statement can both be correct and still differ. They may measure different things or cover different times.
- Charges. One figure may be before charges and brokerage, the other after.
- Open positions. One may include unrealised profit or loss on open trades, the other only realised results.
- Timing. A dashboard can update during the day, while a broker statement or ledger is often final only after the day's settlement.
- Other trades. Your broker account may also show trades placed by hand or by other tools.
- Fees outside trading. The StrykeX plan fee is paid to Stockwiz. It does not appear in your broker ledger.
On the StrykeX P&L screen, Net P&L equals Overall P&L minus charges and brokerage. The plan fee is not part of it. So if you compare the Overall P&L figure with a broker statement that includes charges, they will not match, and that is expected.
How do you reconcile StrykeX with your broker statement?
- Choose one trading day. Export the day's tradebook from your broker account.
- Open the StrykeX order log for the same day.
- Match every order by time, instrument, quantity and side (buy or sell). Note any order in one list and not the other.
- For each matched order, write the price your strategy expected and the price in the tradebook. The difference is slippage.
- Add up charges and brokerage from your broker's contract note. Subtract them from the StrykeX Overall P&L.
- Compare that figure with the Net P&L on the StrykeX screen. Small gaps can come from rounding and timing. A large gap is worth sending to support, with both exports attached.
Do this for one day first and then for a full week. A pattern repeated over many days tells you far more than one odd day.
How do you test a strategy before risking capital?
Test in the order the risk grows. This is the same path we describe for every new strategy.
- Run the Backtest Terminal across at least two or three different market periods, such as a trending period and a sideways one.
- Read drawdown, not only profit. Ask whether you could sit through the worst losing stretch.
- Run Forward Test on live data, with no real capital, for long enough to see a bad week.
- Go live with small size. Keep an order-by-order record of expected and actual price.
- Raise size only after the live record matches what Forward Test showed.
What do the StrykeX tools give you to check this?
StrykeX includes a no-code strategy builder, a Backtest Terminal, Forward Test and 90+ indicators. On 24 Oct 2026 the Yearly Plan was listed at ₹49,999 a year (about ₹4,166 a month), billed annually and including 18% GST. Our guide to Verified P&L and PaRRVA explains how independent verification of performance figures works, and what you actually get when you buy StrykeX lists the plan contents.
If you have already seen a gap you cannot explain, our step-by-step complaints guide shows how to raise it. We also answer the specific claims made in reviews in StrykeX negative reviews answered.
Related articles
Frequently Asked Questions
Why are my StrykeX live results different from the backtest?
A backtest assumes ideal fills with no delay and often excludes charges. Live orders meet slippage, delays, brokerage and statutory charges, so live results are usually lower. Compare each order with your broker tradebook to measure the gap.
Does a high win rate mean an algo is profitable?
No. Win rate counts winning trades, not their size. A strategy can win 8 trades in 10 and still lose money if the losses are much larger than the wins. Look at drawdown, average win and average loss too.
Why does my StrykeX dashboard not match my broker statement?
The two may differ because of charges, open positions, timing and other trades in your account. On the StrykeX P&L screen, Net P&L is after charges and brokerage, and the plan fee is not included. Reconcile one day at a time using the six steps in this guide.
What is slippage?
Slippage is the gap between the price your strategy expected and the price your broker filled. It is larger in fast markets and illiquid strikes. You can measure it by comparing order prices in your tradebook with the expected price.
How do I test a StrykeX strategy safely?
Backtest across several market periods, then run Forward Test on live data without real capital, then go live with small size. Raise size only if live results match the test.
Is StrykeX legit?
One review or screenshot cannot prove that a platform is legitimate, so check it yourself. StrykeX is operated by Stockwiz Technologies LLP, a SEBI-registered Research Analyst (INH000013925). Search that number on SEBI's recognised intermediaries page and confirm the name matches. Then read the refund policy and test a strategy in Forward Test before you pay.
StrykeX — By Stockwiz Technologies