StrykeX Client Story: Suresh Sharma's Algo Trading Journey
StrykeX Client Story: Suresh Sharma's Algo Trading Journey
Suresh Sharma's first weeks on StrykeX, read from his own P&L screens: a red run, two big days, two deep dips and a recovery. One account, not typical.

Suresh Sharma's StrykeX Journey: A Red Run, Two Big Days and Two Deep Dips, Read From His P&L
Quick answer
• From 15 Sep to 16 Oct 2026, Suresh Sharma's FY 2026-27 screen shows overall P&L of ₹1,17,006.50 and net P&L of ₹1,12,103.73 from 151 trades. The account ended in the green, with both traded months in profit.
• He had more red days (10) than green days (9), plus 4 flat days. Two days, 29 Sep and 1 Oct, made about 96% of the total profit.
• The account had two deep dips: ₹12,704.00 below its 16 Sep high by 28 Sep, and ₹69,313.00 below its 1 Oct high by 7 Oct. It made a new high on 15 Oct.
• This is one account, not typical, not a forecast and not a promise. Net P&L is after charges and brokerage but before the StrykeX plan fee.
Suresh Sharma's StrykeX account had more losing days than winning days in its first five weeks, and fell sharply twice. It still ended in the green: overall P&L was ₹1,17,006.50 on 16 Oct 2026, because two big days did most of the work. This is his account, from his own P&L screens. It is not a promise.
Who is Suresh Sharma, and what did he trade?
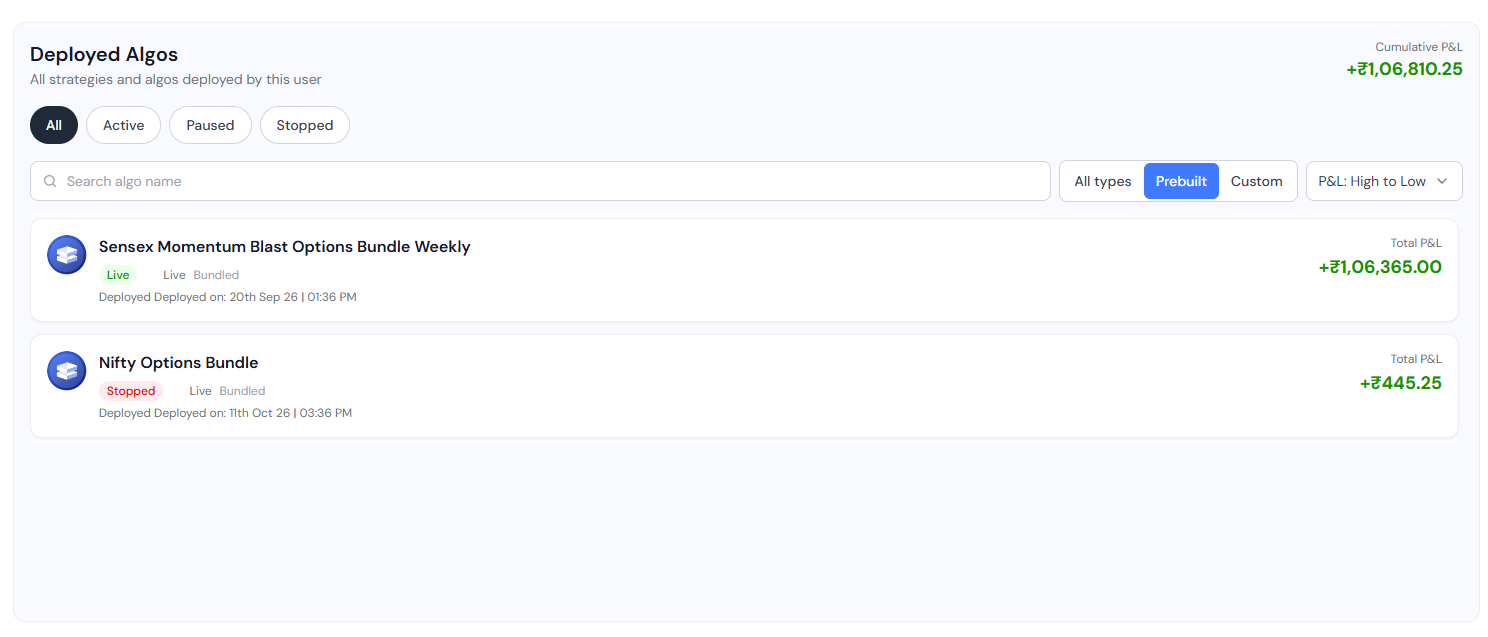
Suresh Sharma is a StrykeX client. His Deployed Algos screen, filtered to pre-built algos, shows two bundles. Sensex Momentum Blast Options Bundle Weekly was deployed on 20 Sep 2026 at 1:36 PM. It is Live, with a total P&L of +₹1,06,365.00. Nifty Options Bundle was deployed on 11 Oct 2026 at 3:36 PM. It is now Stopped, with a total P&L of +₹445.25. Together the screen shows a cumulative P&L of +₹1,06,810.25.
His account trades start on 15 Sep, before the 20 Sep deployment date, and his yearly screen shows ₹1,17,006.50 for the whole account. So the pre-built bundles are not the full picture. The day-by-day story below uses the account totals from his own screens. We have added nothing to them.
Who is Suresh Sharma, and what did he trade?
How did September go, from a strong start to a red run?
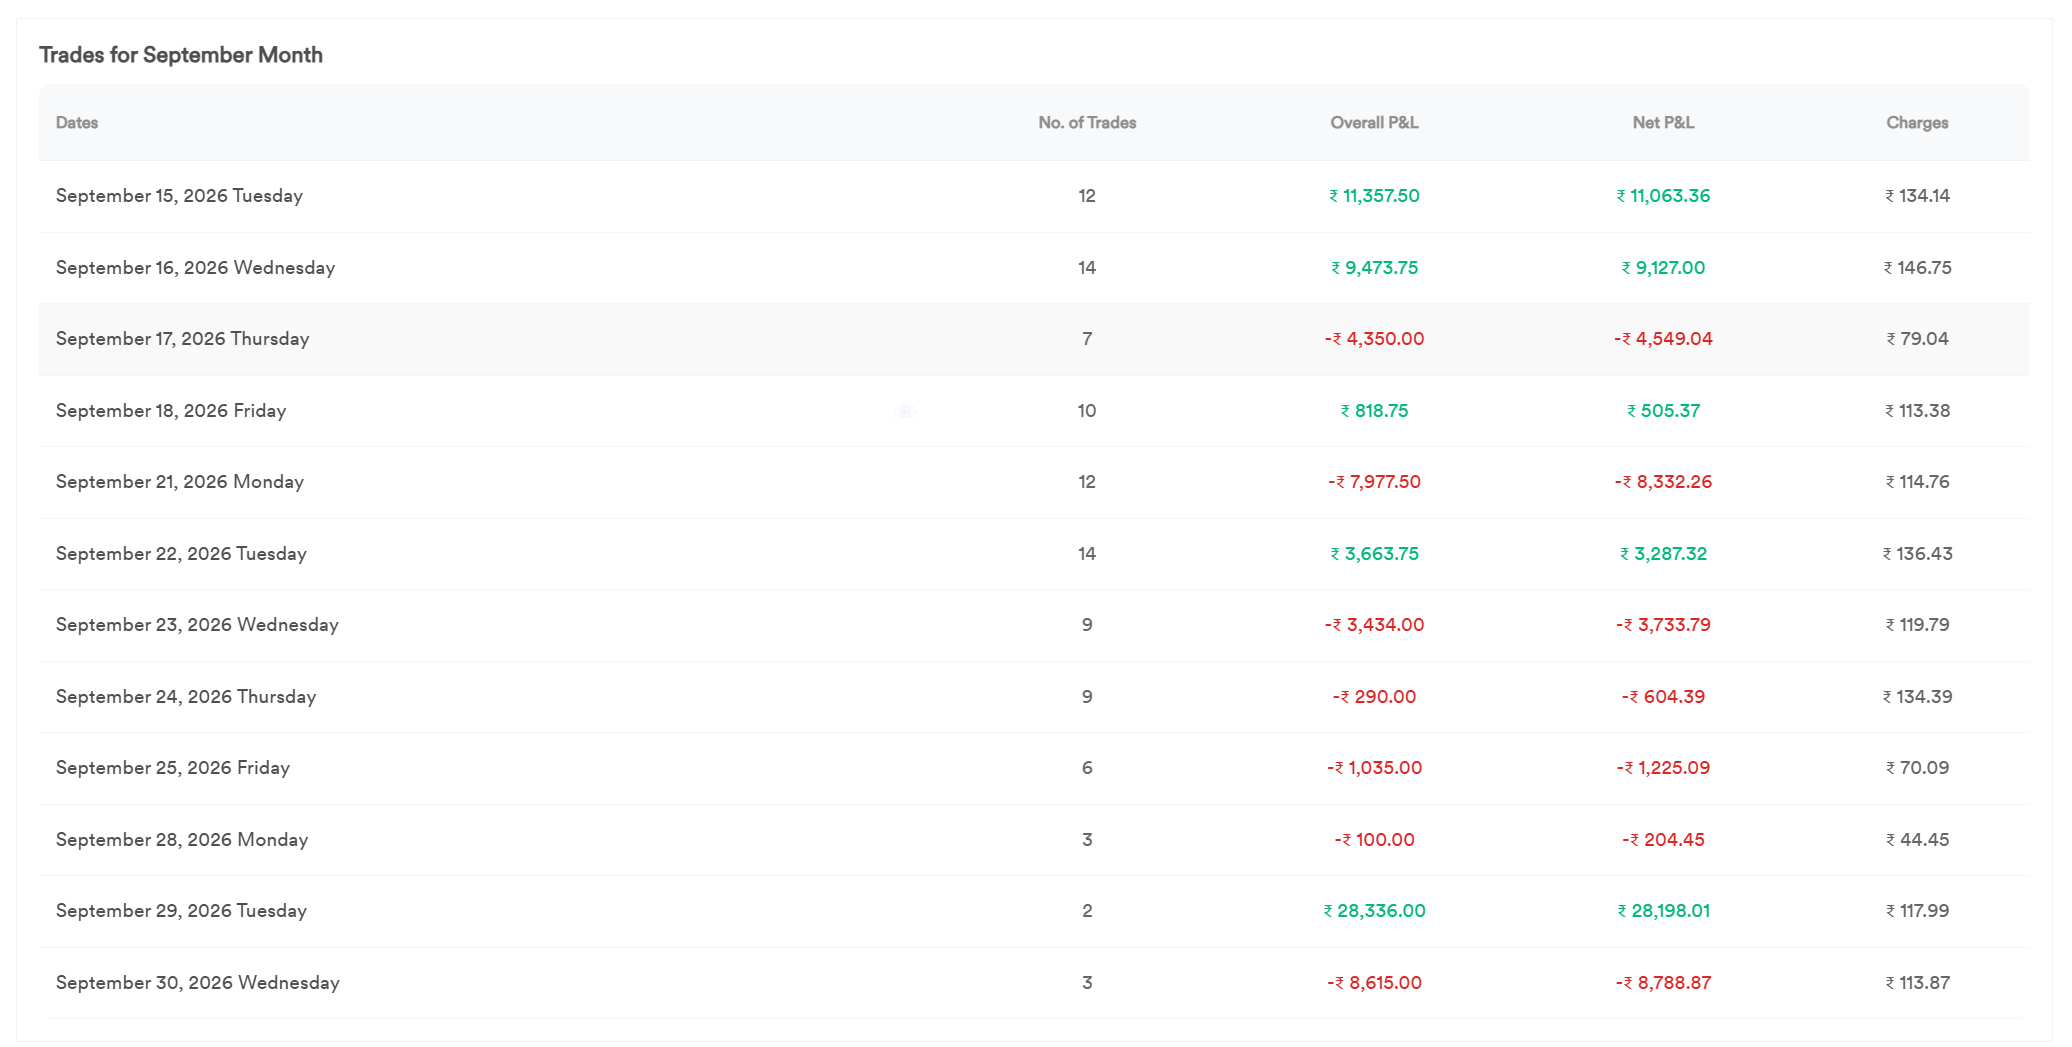
A strong start. 15 and 16 Sep made ₹11,357.50 and ₹9,473.75. By the close of 16 Sep the account was ₹20,831.25 up.
Then a red run. 17 Sep lost ₹4,350.00. 21 Sep lost ₹7,977.50. 23, 24, 25 and 28 Sep were all small losses. With only two small wins (18 and 22 Sep) in between, the account fell to ₹8,127.25 by 28 Sep. That is ₹12,704.00 below its 16 Sep high, over eight trading days.
Then one day changed the month. On 29 Sep, 2 trades made ₹28,336.00. 30 Sep gave back ₹8,615.00. September closed at ₹27,848.25 overall and ₹24,743.19 net, from 101 trades. Five days were green and seven were red.
How did September go, from a strong start to a red run?
What happened in October?
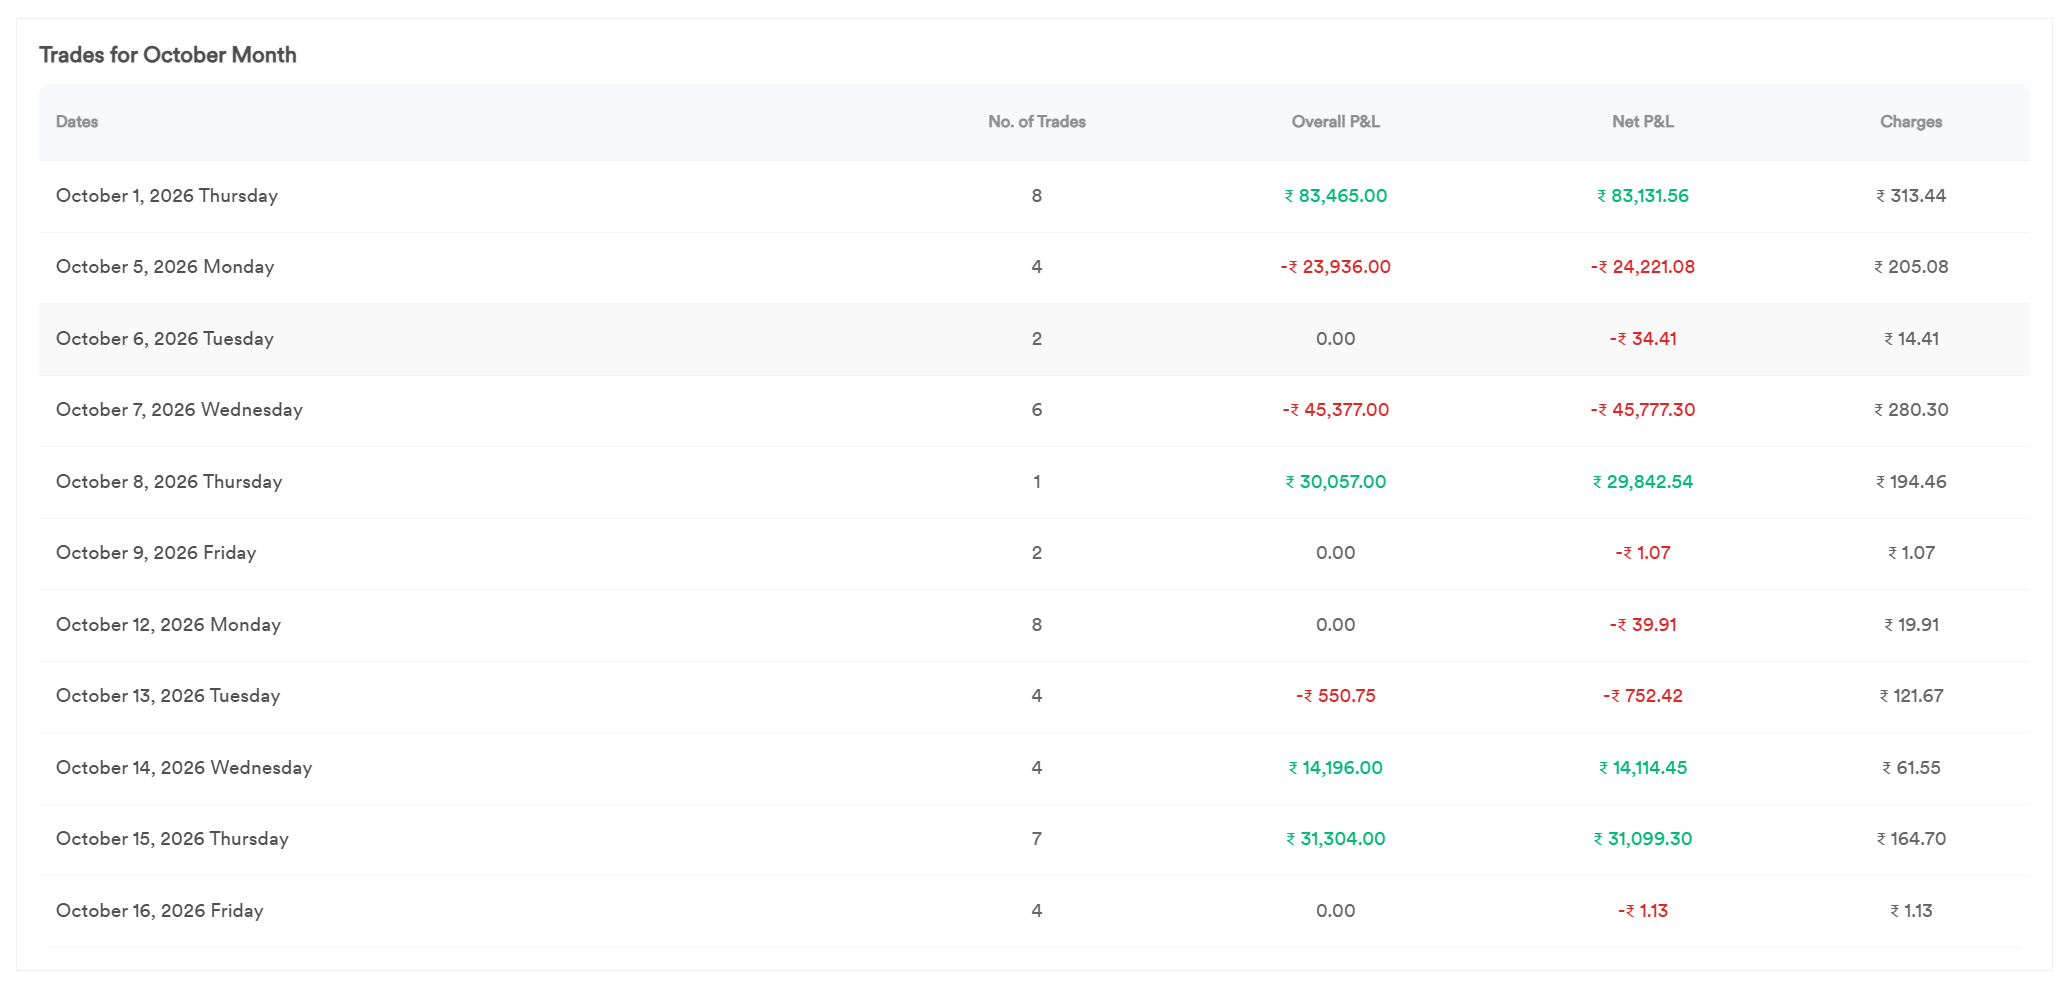
The biggest day in the account. 1 Oct made ₹83,465.00 from 8 trades. That lifted the account to ₹1,11,313.25 overall, its high point.
Then the sharpest fall. 5 Oct lost ₹23,936.00 and 7 Oct lost ₹45,377.00. In two trading days the account fell ₹69,313.00, about 62% of the profit it had built up to 1 Oct.
Then a recovery. 8 Oct made ₹30,057.00 from a single trade. 6, 9, 12 and 16 Oct show 0.00 overall P&L, with only charges and brokerage in the net figure. 13 Oct lost ₹550.75. 14 and 15 Oct made ₹14,196.00 and ₹31,304.00. The account passed its 1 Oct high on 15 Oct.
What happened in October?
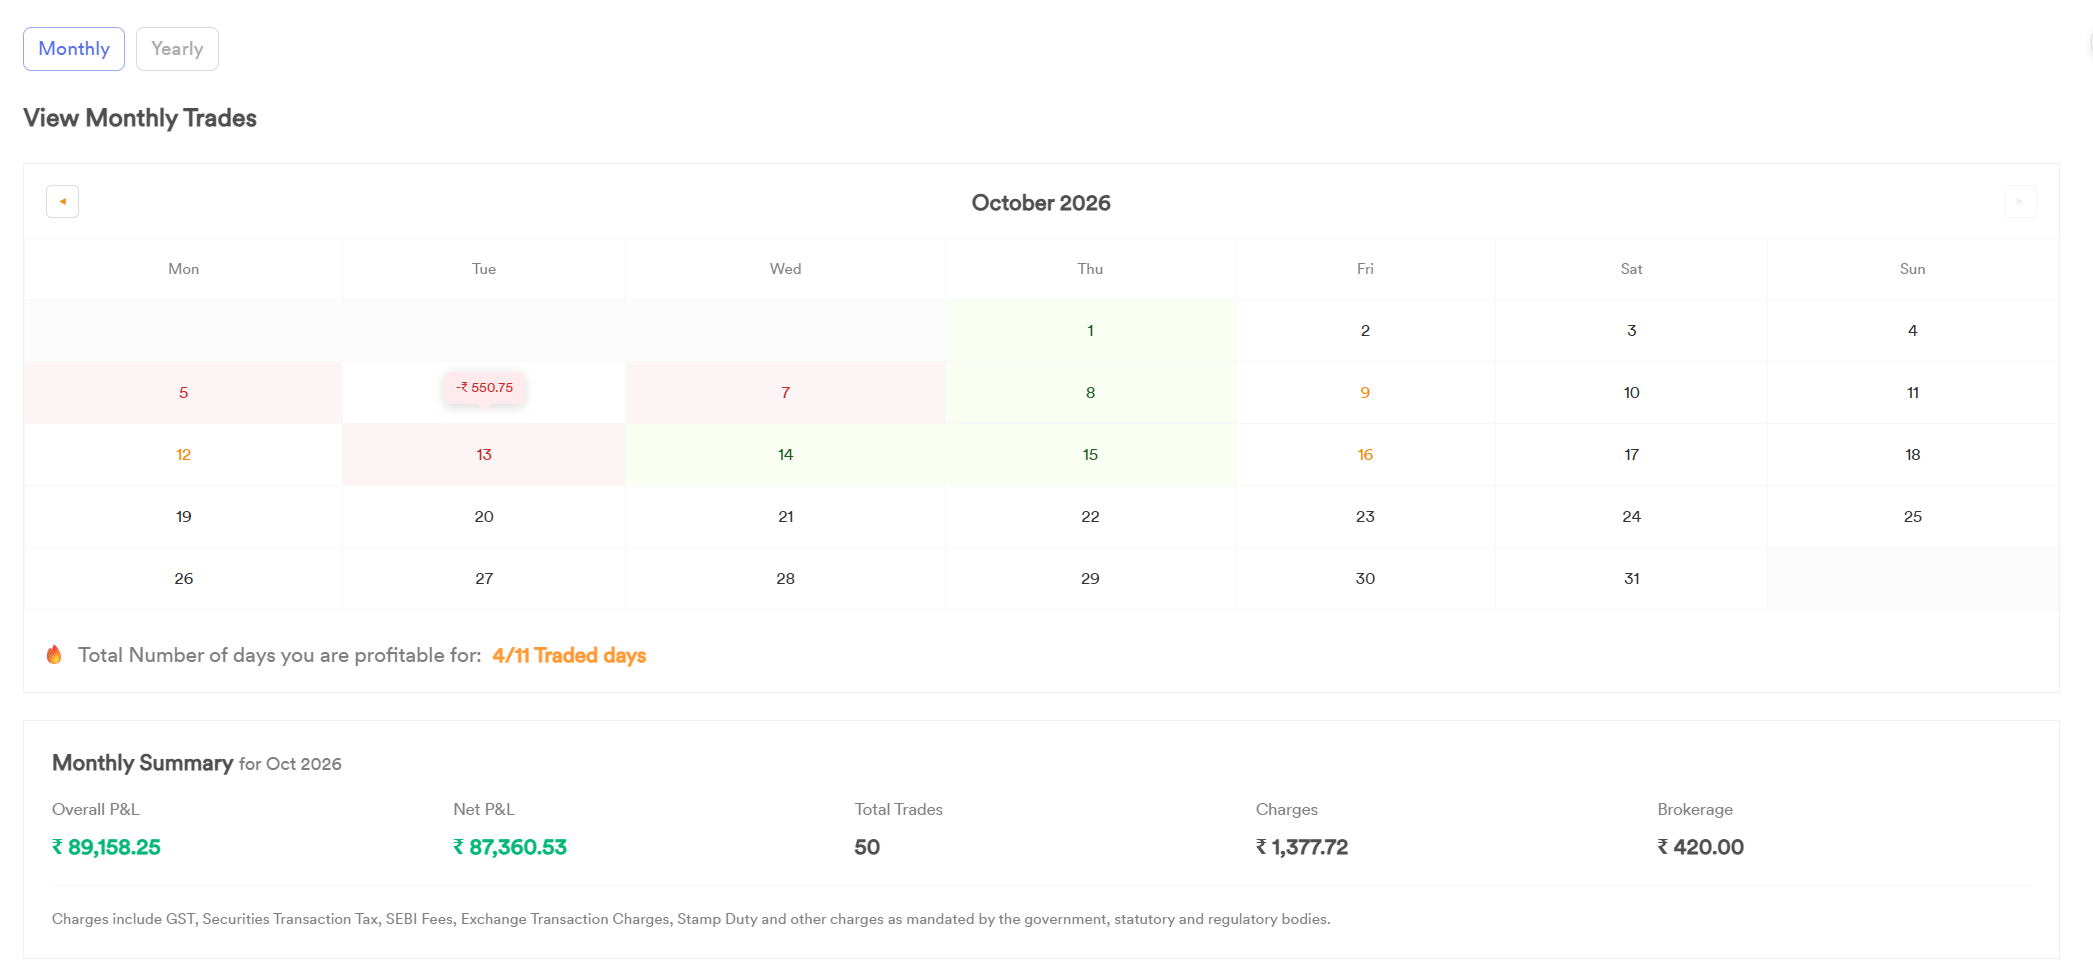
StrykeX monthly trades calendar and summary for October 2026
What does the full financial-year view show?
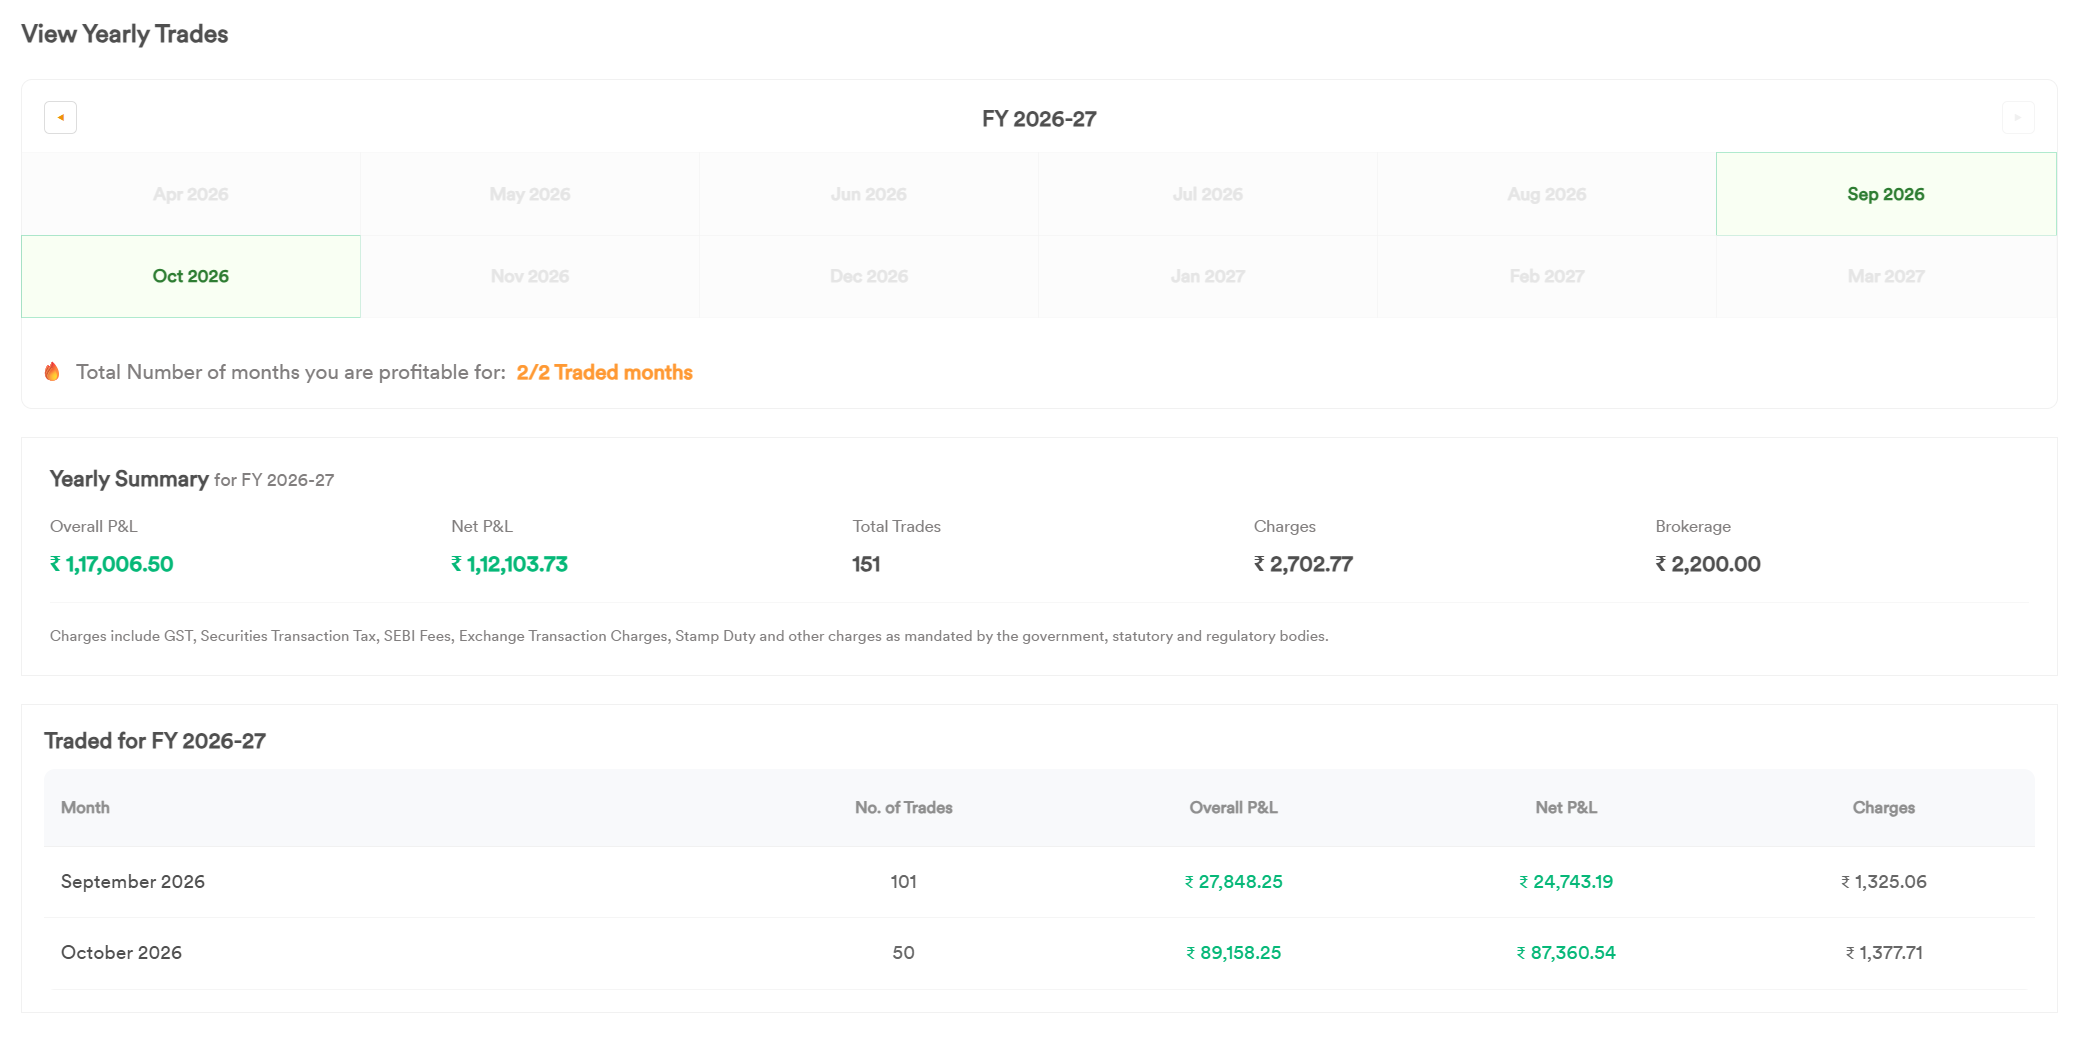
The Yearly view adds September and October for FY 2026-27. The screen shows Suresh as profitable in 2 of 2 traded months. Net P&L is overall P&L less charges and brokerage.
Charges and brokerage together came to ₹4,902.77, about 4% of the overall P&L. These screens show trading P&L only. They do not include the StrykeX plan fee. Differences of a few paise between screens, such as October net P&L of ₹87,360.53 and ₹87,360.54, come from rounding.
How it ended. On 16 Oct 2026, the last day on his screens, Suresh's account was in the green: ₹1,17,006.50 overall and ₹1,12,103.73 net, with both September and October in profit. That is where the account stood on that date. It is not a forecast of where it will be.
What does the full financial-year view show?
What does Suresh's account look like week by week?
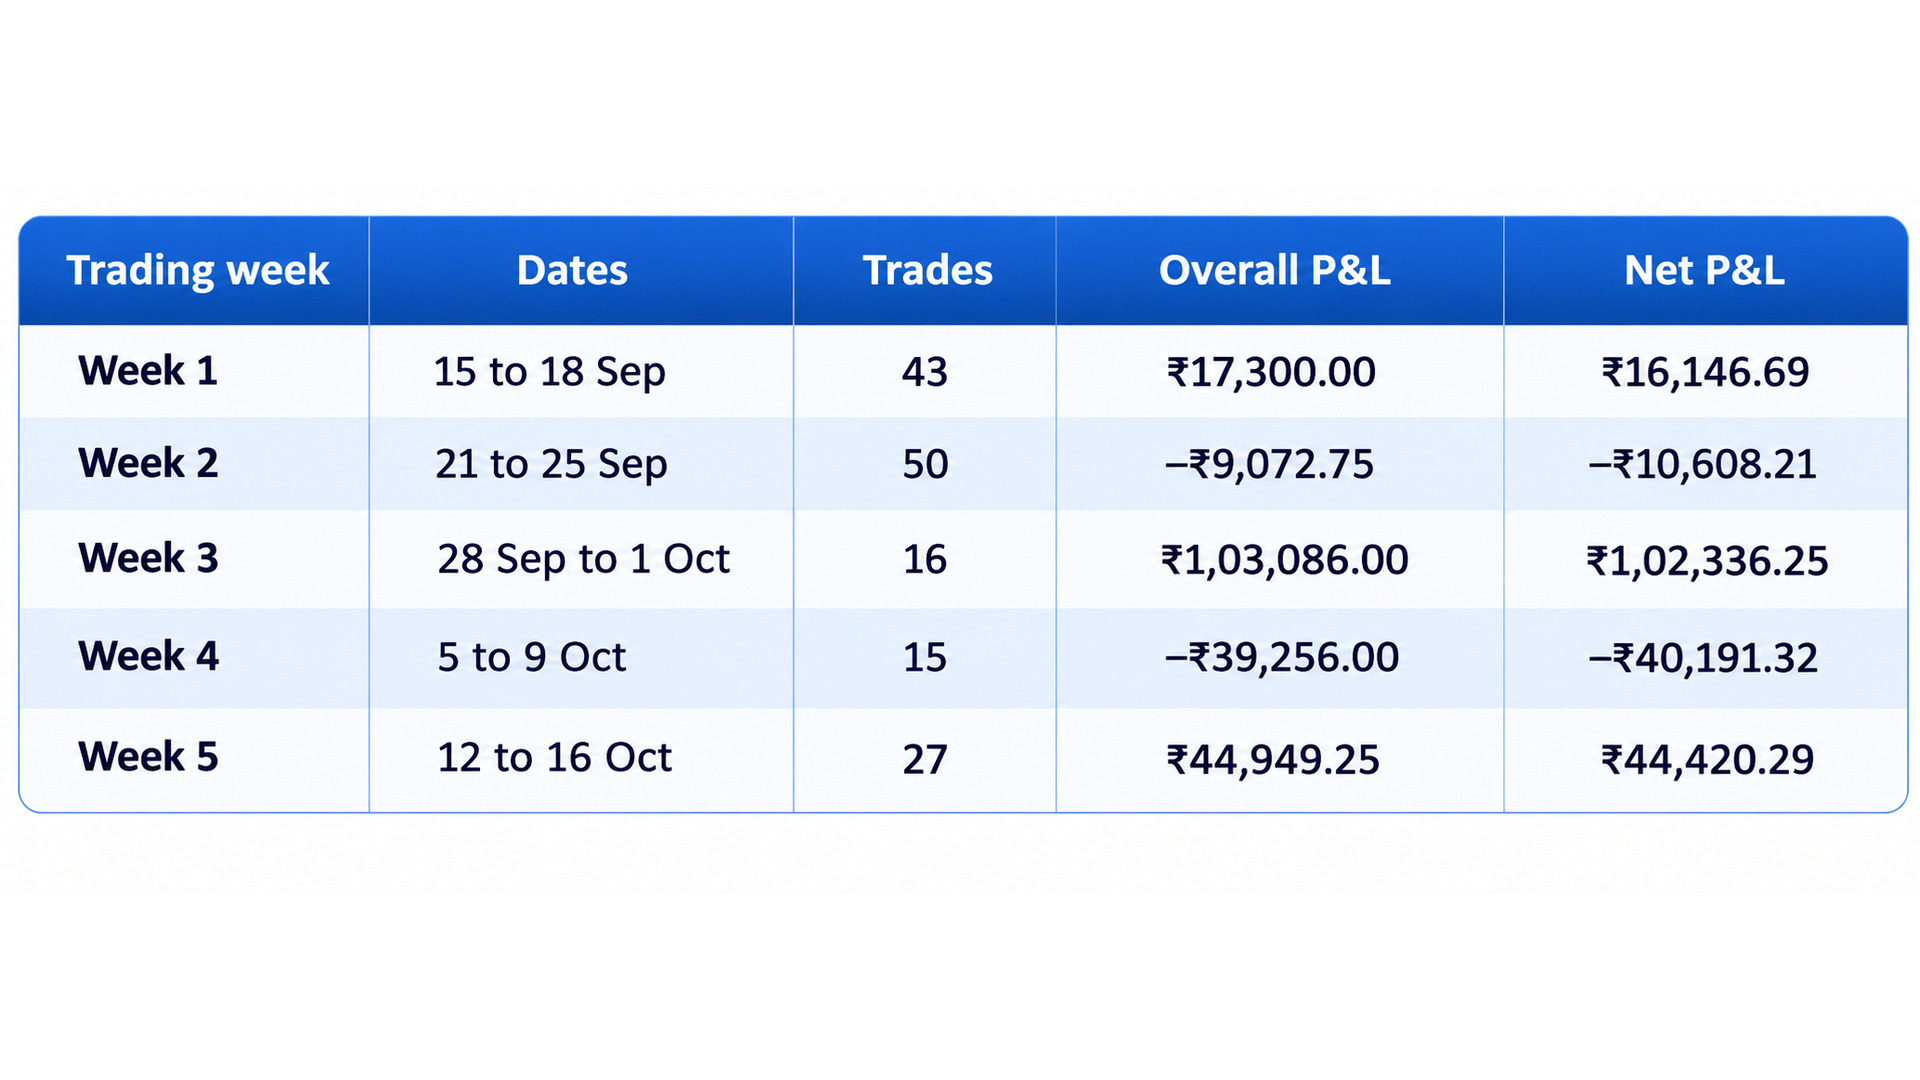
Across 23 trading days, 9 were green, 10 were red and 4 were flat. Winning days averaged about ₹23,600. Losing days averaged about ₹9,600. Two days, 29 Sep and 1 Oct, made ₹1,11,801.00. That is about 96% of the total profit.
What does Suresh's account look like week by week?
What does Suresh's journey tell a new algo trader?
This is our reading of the numbers, not Suresh's words.
- You can have more red days than green days and still finish in profit. Here the few green days were much larger than the red ones. Nobody can know in advance which days those will be.
- Profit can depend on very few days. Without 29 Sep and 1 Oct, the account would be only about ₹5,200 up. A trader who switched off in the red run of 17 to 28 Sep would have missed both.
- Dips can be deep. The account gave back ₹69,313.00 in two days. Your position size and loss limits decide whether you could sit through that.
- Every cost is on the screen. Each day shows charges, and the summaries show brokerage. You can compare each trade with your broker's tradebook.
It does not show that this will repeat. It is one account over 23 trading days, and the capital and position size are not on the screens, so we show no percentage return. SEBI's FY26 study found that 87.7% of individual F&O traders had net losses. Many clients will have a different month, and some will lose money.
Some clients leave after a red run, and some post a negative review. That is their right, and we want to know why. Our guides on Non-Directional Option Strategies in India: Payoffs in ₹ and Top 10 Benefits of StrykeX for Indian F&O Traders (2026). For another account, read Ravidas's first month on StrykeX.
Is StrykeX's price high, and what does the plan include?
Some people find ₹49,999 a year high. That is a fair view, and price is a personal choice. The better question is what you get and how much you will use it.
When we read the pricing page on 24 Oct 2026, the Yearly Plan was listed from ₹4,166 a month, billed annually at ₹49,999 including 18% GST. No Cost EMI on credit cards and UPI EMI were also listed. The plan includes:
- Fully Automatic Trading in equity, futures and options.
- A no-code Custom Strategy Builder with 100+ indicators.
- 30+ pre-built algo strategies, which is where bundles like Suresh's come from.
- A Backtest Terminal with unlimited backtest credits.
- Forward Test, to run a strategy on live market data without real capital.
- An Options Wizard and an Advanced Algo Trading Course.
To judge value, use these points. They are better than comparing the fee with one client's profit.
- List the tools you would actually use: the builder, backtests, Forward Test, pre-built algos or the course.
- Think about how often you will trade, and with what capital. A plan costs the same in a busy month and a quiet one.
- Remember that the P&L screens in this story do not include the plan fee. Do not read a client's net P&L as profit after the subscription.
- Try Forward Test and the Backtest Terminal first, and read the refund policy, before you commit.
What should you do before your first live week on StrykeX?
Test first, then go live small. These steps apply to any strategy.
- Backtest over more than one period in the Backtest Terminal. Read each result as a simulation.
- Run it in Forward Test on live market data without real capital.
- Write down your maximum loss for a day and a week before you deploy. Stopping at a limit you set in advance is a plan, not a failure.
- Choose a position size you could hold through a fall like 5 to 7 Oct without wanting to stop.
- In the first weeks, compare each order with your broker's tradebook. This is also how you check any complaint fairly.
To see how past returns can be checked independently, read how Stockwiz approaches PaRRVA and Verified P&L.
Related articles
Frequently asked questions
What did Suresh Sharma's first weeks on StrykeX look like?
Mixed, but it ended in the green. From 15 Sep to 16 Oct 2026 his account had 9 green days, 10 red days and 4 flat days. It fell twice, by ₹12,704.00 in September and ₹69,313.00 in October, made a new high on 15 Oct, and was in profit overall on 16 Oct.
How much did Suresh Sharma make on StrykeX?
His FY 2026-27 screen shows overall P&L of ₹1,17,006.50 and net P&L of ₹1,12,103.73 after ₹2,702.77 charges and ₹2,200.00 brokerage, from 151 trades, up to 16 Oct 2026. This excludes the plan fee, and it is one account that is not typical.
Is it normal to have more losing days than winning days in algo trading?
It can be. Some strategies lose small amounts often and win large amounts rarely. In this account, 10 days were red and 9 were green, yet the profit from the green days was larger. This does not mean every strategy works this way.
Is StrykeX worth the price?
It depends on how much you will use it. The Yearly Plan was listed from ₹4,166 a month, billed annually at ₹49,999 including 18% GST on 24 Oct 2026. It includes the strategy builder, pre-built algos, the Backtest Terminal, Forward Test and a course. Try Forward Test first and check the pricing page for today's price.
Are these results typical for StrykeX clients?
No. This is one client's account over 23 trading days. Results differ by strategy, capital, position size and market conditions. Some clients lose money.
How can I test a strategy before risking capital?
Use the Backtest Terminal to test over several periods, then Forward Test to run the strategy on live market data without real capital. Both are part of StrykeX.
StrykeX — By Stockwiz Technologies